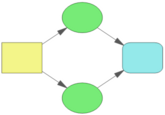
The DPL Model Window provides a graphical interface for building DPL decision models. The DPL Model Window contains both an Influence Diagram Pane and a Decision Tree Pane -- though they both are not necessarily visible at once. In the Influence Diagram you create nodes and specify their relationships. For more on the Influence Diagram see Influence Diagram Overview. In the Decision Tree you specify the chronology and structure of events and the manner in which the values are paid or received. For more on the Decision Tree see Decision Tree Overview. Once the diagrams for a model are complete, you can run and analyze the model from either pane, or you can generate code that can be viewed in a Program Window.
To activate the Model Window, double click on the item for it in the Workspace Manager or press the keyboard shortcut Ctrl+F12.
Views
When you first enter the Model Window, the Decision Tree pane is maximized by default within the Model Window. The Influence Diagram pane is present but minimized and so, hidden from view. You can change the default maximized pane setting for new models via the "For new models, maximize pane" setting within File | Options | General. You can choose to have the Decision Tree pane maximized, the Influence Diagram pane maximized, or a halfway split with both panes visible. When the Model Window is in halfway split mode, the Influence Diagram pane will be at the top with the Decision Tree pane on bottom. You can click and drag the splitter bar between the panes to change the proportion of each pane. Dragging the splitter bar to the edge of the window will make only one of the panes visible, as will double-clicking on the splitter bar. Double-clicking the splitter bar again sets it to the half-way split. Pressing the Tab key switches back and forth between panes. To split the Model Window vertically, select View | Layout | Vertical Split.
If a new DPL workspace is opened and a single pane is maximized -- you'll notice a semi-transparent watermark located in the top left corner of the pane, indicating which pane is active/visible.
If the Decision Tree pane is maximized, the Decision Tree tab will be active on the ribbon and you will see the following indicator:

If the Influence Diagram pane is maximized, the Influence Diagram tab will be active on the ribbon and you will see the following indicator:

Model Area
The active pane consists of a white drawing area. A drawing (i.e., model) may be larger than the drawing area. By scrolling and zooming in and out on the drawing area, you can create a drawing of practically any size.
Sizes
Each influence diagram node is drawn large enough to fit around the name, and each decision tree branch is displayed in a size large enough to fit the branch label. Depending on your font selections within View | Font, the text may be too small to read on the screen. You can either increase the font size or zoom in on the diagram. The diagram appears on the screen as it will appear on the page when printed.
Versions: DPL Professional, DPL Enterprise, DPL Portfolio
See Also