DPL Fault Tree is a straightforward yet powerful tool that offers all of the features of DPL Professional plus the ability to build and analyze Fault Trees.
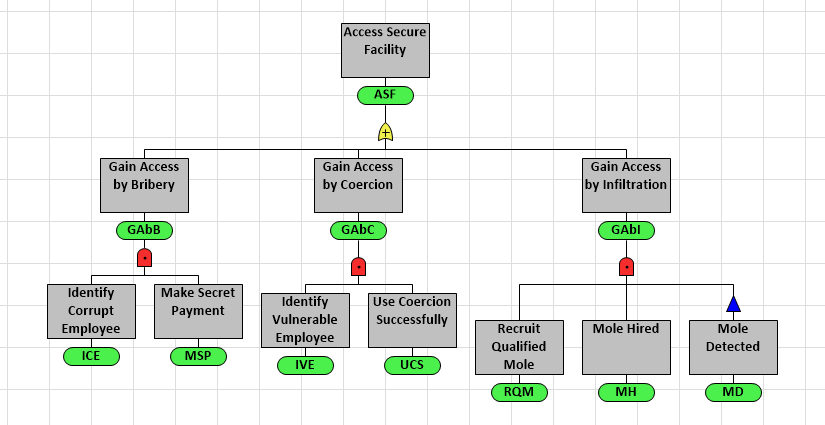
A Fault Tree is a hierarchical model used to analyze the probability that an event will occur. The event is typically a low probability, high consequence risk or outcome such as a failure of a critical system or a breach of security. DPL 9 Fault Tree provides all the tools needed to build graphic representations of large-scale problems gracefully so you can understand the risks involved in a given system and how they relate to one another. This leads to a more accurate risk assessment and a quantitative method for assessing actions that can reduce risk. The DPL Fault Tree shown above breaks down the breach of a secure facility. For a simple introduction, watch our video:
Fault trees are used in numerous applications including analyzing the safety of nuclear power plants, the reliability of launch vehicles and the security of computer networks. DPL Fault Tree offers all of the power and features of DPL Professional, plus a rich set of Fault Tree modeling constructs, including:
- Basic events
- AND gates (any number of inputs)
- OR gates (any number of inputs)
- NOT gates (to build noncoherent fault trees)
- Probability value nodes
- Dependent events
Advanced Features and Outputs
Module Embedding
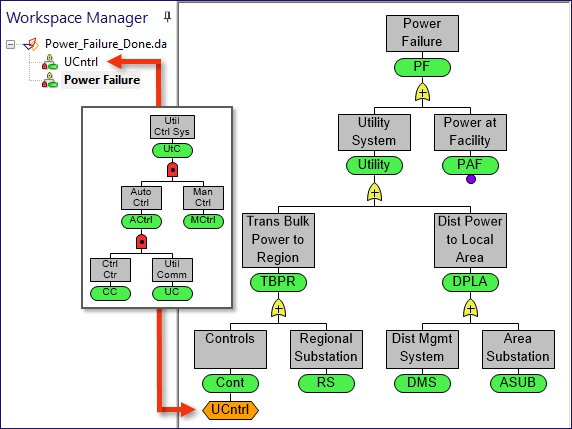
A fault tree module can be embedded within other fault trees when it’s convenient to split a larger, complex model into several smaller parts. Modules can also act as custom gates that can appear multiple times in the same fault tree.
In the figure shown, the DPL Fault Tree analyzes the risk of a power failure at a critical industrial site. One of the events that could affect the reliability of the power system is a failure of transmission controls (bottom left corner). The Controls event in the Power Failure fault tree will depend on a module reference to the Utility Control System (UCntrl) fault tree.
Module Embedding
Power Failure Fault Tree
A DPL Fault Tree can be standalone or incorporated into a DPL Decision Model via fault tree modules. The motivation for a fault tree analysis is usually some kind of decision. If you know how likely a system failure is, you will have a better idea of how much to spend to prepare for the consequences. Further, if you know the modes of failure, you can assess how much certain risk mitigation measures will help. When these decisions aren’t simple enough to be considered implicitly, you can embed the fault tree in a decision model and use influence diagrams and decision trees to explicitly analyze the decisions.
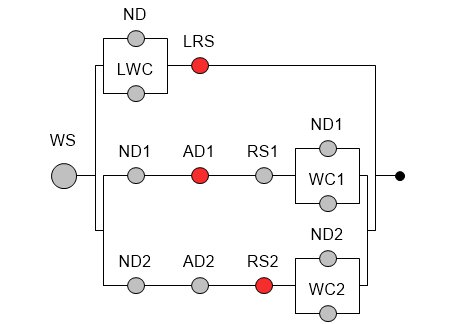
Circuit Diagrams
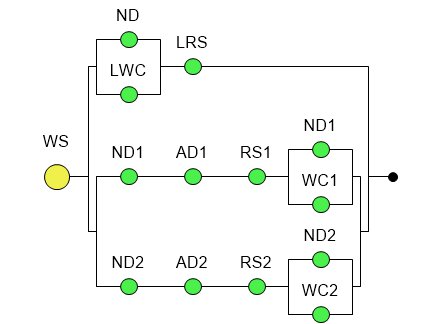
A circuit diagram is an alternative way of looking at the structure of a fault tree. The system will fail if the “circuit” is broken – that is, if all the lines from the “power source” on the right to the “light bulb” on the left are cut. A circuit diagram provides a graphical view of the qualitative aspects of the system, such as redundancies and single points of failure.
In DPL, you can switch between the tree and circuit diagram views of a fault tree at the press of a button.
Minimal Cut Sets
The central fault tree analysis is the calculation of minimal cut sets. A cut set is a list of component failures that would result in system failure; it is minimal if it doesn’t contain any unnecessary failures. DPL Fault Tree has a fast, proprietary algorithm for calculating minimal cut sets which can be displayed in tabular or circuit diagram format. With either view you’ll be able to see the probability of occurence and the cost of each cut set. Sorting the cut sets by cost allows you to focus on the “cheapest” failure points, i.e., the ways an adversary could most easily attack the system.
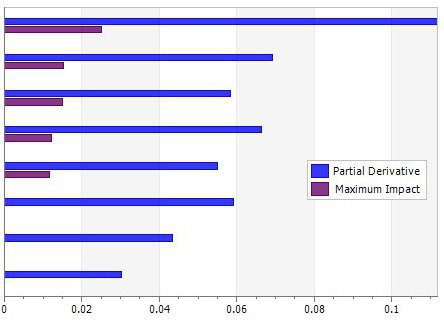
Partial Derivatives
Partial derivatives are a form of sensitivity analysis that offers insights into the relative importance of the basic events in the fault tree. A partial derivative shows how much a change in the probability of each basic event affects the probability of the top event. Maximum impact of basic events shows how much the probability of the top event can be reduced by setting the probability of basic events to zero.
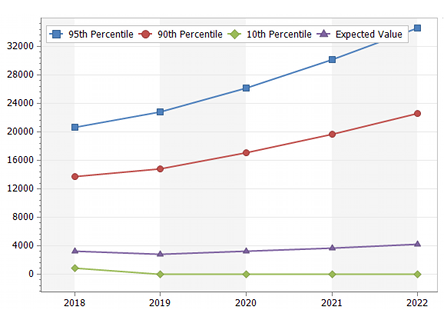
Time series
Often the probability or costs data associated with events in a fault tree evolve over time. In DPL Fault Tree you can set up time intervals and define time series events or values to capture this evolution and generate a Time Series output to visualize how risks and/or costs change over time.