If you’ve recently upgraded to or downloaded a trial of DPL 8, you may have noticed a DPL tab has suddenly appeared in your Excel ribbon with the installation of the software. Don’t worry, that’s not a bug. It’s an exciting new feature we like to call DPL’s Excel-side interface; an easy-to-use modeling framework built right within Excel’s ribbon interface.
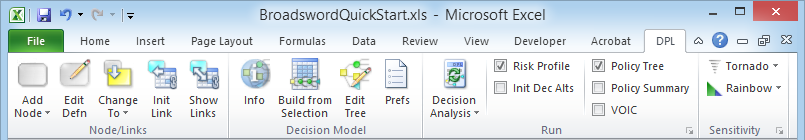
For those Professional, Enterprise, or Portfolio users, modeling within Excel is an optional feature. Let me outline your newly expanded list of choices when starting to develop a new probabilistic model:
- Quickly and easily perform decision and risk analyses right within Excel using DPL’s fundamental features
- Start modeling within Excel for rapid spreadsheet-centric analyses and switch over to the full, standalone modeling environment (without starting over) when the model outgrows the XSI functionality
- Stick with the rich, stand-alone DPL modeling environment you’ve come to know and love from the start to finish (we won’t fault you)
If you’re familiar with our family of DPL products, you may be asking, “What about that other version, DPL Standard?”. Well, we’ve replaced DPL Standard with a fresh, new version, DPL Direct. DPL Direct is a straightforward, entry-level version that keeps it simple and familiar. DPL Direct is a pure Excel Add-in, so you only need to worry about choice #1 above. As the name indicates all the decision modeling is done directly within Excel and all the data required by the decision model is stored directly in the Excel workbook. So, what are some of the benefits of starting out or solely modeling within DPL’s Excel-side interface?
Simplicity
- One file, one application
- No need to worry about setting up links between DPL and Excel correctly
- All the core DPL features you need and none of the Advanced features you don’t need
Time Saving
- Fewer clicks!
- Quicker set-up and analyses
Streamlined
- Excel Native Outputs, easily tweaked to match other, non-DPL charts you need in your presentation
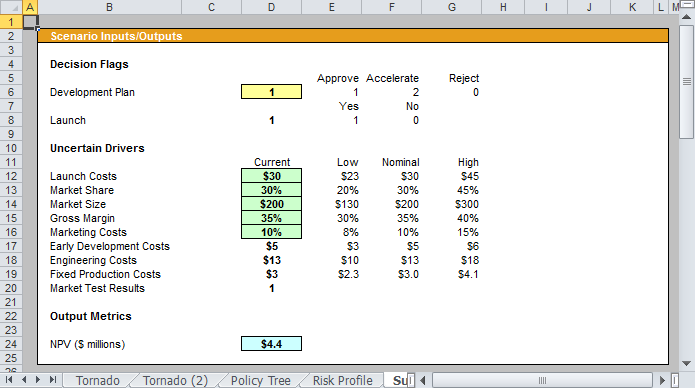
Tip: When setting up a spreadsheet for analysis all the assumptions, parameters, and metrics should be grouped together on the same sheet.
While there are numerous benefits to reap from DPL’s XSI for some types of analyses, the simplicity doesn’t match the requirements of every DPL application. If you possess a bevy of complex .DA files that you’ve been refining since the 90’s, your analysis merits the use some of the more advanced DPL features like Multiple Attributes and Endpoint Databases or your calculation are better suited to be done within DPL then you should stick with the full standalone modeling environment of the Professional, Enterprise, or Portfolio version.
Now, if you’re an Excel guru but a decision/risk analysis beginner, an old-time user that commonly uses spreadsheet-centric analyses or feel you are otherwise well-suited to DPL’s new Excel-side interface then give it a try! There’s no reason to be intimidated, Syncopation offers some proficient modes of instruction to assist you in getting started in the right direction on the Excel side of things.
Start by grabbing some popcorn, or your preferred software demo video viewing snack, and watch our DPL Demo Videos series; a set of 4 short (less than 6 minutes) software video tutorials. If you are more the reading type than check out the DPL 8 Direct Quick Start Guide available for download in PDF format here and also installed with your trial or purchased license within the “Documentation” folder of your DPL install directory. Looking for something more in-depth? Send an e-mail to support@syncopation.com and inquire about one of our interactive web training sessions.
Notice below that users registered at our website are able to leave comments on this and all blog posts. Love the new feature? Think it can be improved? Decidedly dislike it? Please post a comment and let us know. We welcome and value your input.