Syncopation’s recent Fed Rate Hike promotion not only offers you an opportunity to save money on new or upgraded licenses of DPL, it also gives us a platform to discuss important decision making principles, like the value of information.
One of the most powerful facets of a Decision Analysis approach is the ability to explicitly calculate the value of information so one can make an intelligent choice about whether or not to buy it. If you’ve read our blog before you should already know the following wisdom about VOI:
- Time is money, therefore, information gained is never free
- More information (even when acquired cheaply) isn’t always a benefit to an analysis
- Information is only valuable if it has the ability to change your decision
While it’s dead easy to calculate the value of perfect information, in the real world, we tend to come across a lot more imperfect information. Imperfect information is more subtle and requires more smarts – but it can still be calculated with our favorite decision analysis tool, the decision tree.
In an earlier post I talked about DPL’s Bayesian Revision feature. I touched on the fact that many times in decision modeling there is an opportunity to observe the outcomes of interim uncertainties that will inform you about the outcome of a longer term uncertainty of interest. Further you might need to assess the conditional probabilities one way (in the Influence Diagram) but encounter the actual events chronologically in the opposite order (in the Decision Tree).
One prime example of the phenomenon described above will occur next week when the Fed releases the minutes from its September 20-21 meeting. Bond markets will go nuts devouring all the juicy imperfect information buried in those fedspeak run-on sentences. (“Going nuts” is relative; for the bond market it might mean interest rates move 0.05%.) Since we already have a model from our last blog post, I’ll dive in and calculate the value of this information – and weigh it against the potential savings. This analysis will help you to decide if you should buy now or wait for the possibility of a bigger discount.
We’ve said imperfect information is subtle but it can be even more confounding when you don’t know how good the information is. Ideally, you would know the quality of a test: what is the probability of type I and type II error (https://en.wikipedia.org/wiki/Type_I_and_type_II_errors). However in business, more often than not there is uncertainty not only about the underlying issue (e.g., will the fed raise rates) but also about the quality of the “test” (the meeting minutes). When confronted with all that uncertainty and meta-uncertainty, the best you can do is a) make a reasonable assessment and b) do a lot of sensitivity analysis.
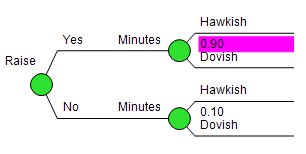
In our model, we assumed that the info garnered from the meeting minutes is really good. As you can see in the data input tree for the Minutes uncertainty to the right, we entered a probability of .90. That’s very optimistic for tea leaf reading. Are you less convinced? Well this is where a sensitivity analysis can help.

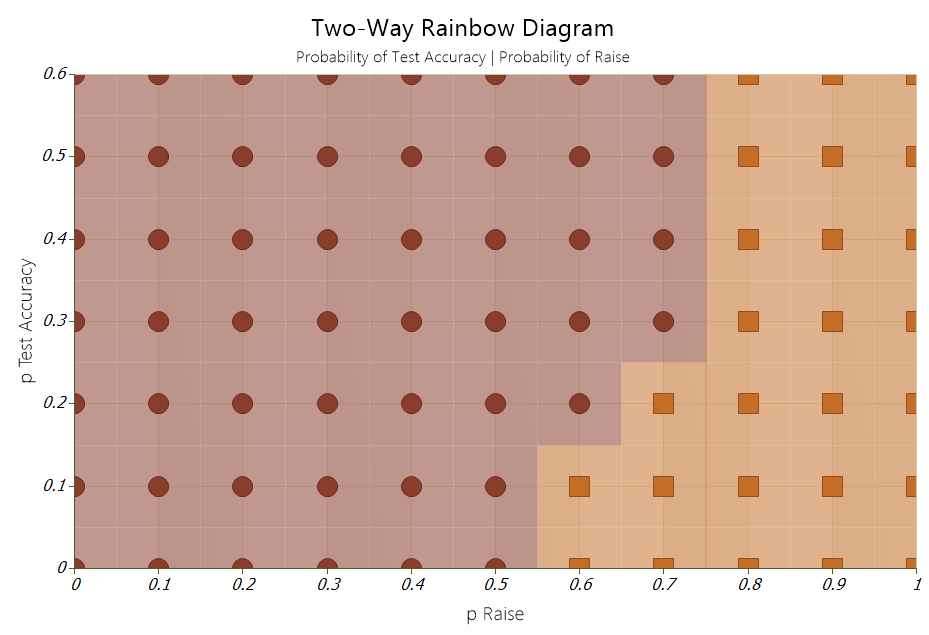
I can easily test the robustness of the decision policy by generating a two-way rainbow diagram. To generate the output DPL varies the two quantities of interest, the test accuracy and the probability of a hike in rates, over a given range. More specifically DPL will run the model once for each combination of values. In the chart below a change in color indicates a change in the optimal decision policy for that combination of values. The brown indicators tell you to buy now, while change to orange indicates that it’s best to wait for those combination of values. Now you can make an even more educated decision on when to cash in on our Fed Rate Hike DPL Promotion!

The bottom line is unless you think a rate hike is likely (>50%), it doesn’t matter how good the test is, it’s better to lock in the 25% discount now.