So, what is a parametric spreadsheet?
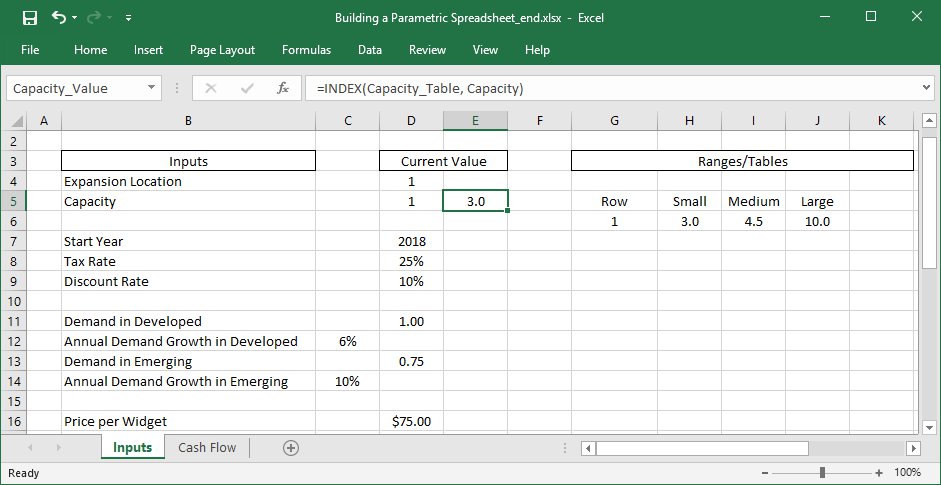
Valid question. In comparison to a static/base case/deterministic spreadsheet, a parametric spreadsheet is set up in such a way that key parameters and assumptions can be changed without invalidating the underlying calculations. So if you’ve found that your project is delayed by a year or that CAPEX is higher than anticipated – you can incorporate these changes into your spreadsheet without breaking everything and instantly see how they affect value.
Why did you make a video about it?
In my 8 years at Syncopation Software I’ve taught many live, DPL web training courses in which my first task is to show users how to quickly create a DPL model from a parametric Excel spreadsheet. I usually prompt them to take a cursory glance at the spreadsheet and point out a few highlights before quickly turning attentions back to the star of the show, DPL.
But as I mentioned in another popular blog post on the subject Setting up your Excel Cash Flow Spreadsheet for Easy Scenario Analysis:
“We often find ourselves helping people start a DPL analysis from an Excel spreadsheet, but in many cases the difficult modeling is in the spreadsheet itself.”
And not surprisingly, I came to find that there is a subset of DPL training participants that desired a deeper understanding of the parametric Excel spreadsheet that I touch upon so fleetingly. In response to these appeals, I’ve created a two-part video tutorial series in which I show the steps to building a flexible, parametric Excel spreadsheet model from scratch.
What can I do with one of these parametric Excel spreadsheets?
News flash: uncertainty is inherent in just about every single strategic business decision you make. With a parametric spreadsheet you are effectively capturing the value of the many future states of the world (i.e., scenarios) given the uncertainty surrounding the input parameters of the decision (markets, price, costs, regulations, etc.).
You can take your scenario analysis one giant leap forward by linking your parametric Excel spreadsheet to the best-in-class decision analysis tool, DPL. You can leverage the intuitive modeling features within DPL to apply a consistent decision analytic framework to your decision-problem by explicitly defining:
- decisions and their alternatives
- probabilities for the outcomes of the uncertain parameters
- the output metric you want to maximize (or minimize) for your decision(s)
- the chronology of said decision, uncertainties, and get/pays (values paid/received)
- conditional relationships between variables
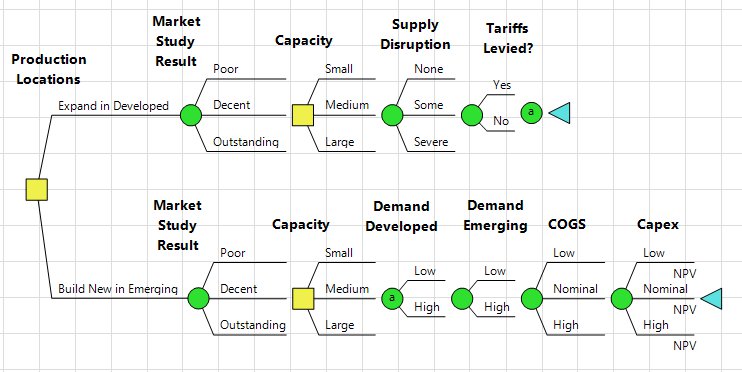
When the DPL decision model is analyzed – the alternative with the greatest expected value of the output metric is indicated at each decision point ensuring the best strategy is followed given the range of outcomes that are possible.
Without further ado, here are the Building a Parametric Excel Spreadsheet Model, Video’s 1 & 2 along with the Excel workbooks files you should have at the end of Videos 1 & 2.