We often find ourselves helping people start a DPL analysis from an Excel spreadsheet, but in many cases the difficult modeling is in the spreadsheet itself. In this post I’m going to provide you with a few simple tips for preparing your spreadsheet in a way that makes setting up and running a scenario analysis a breeze.
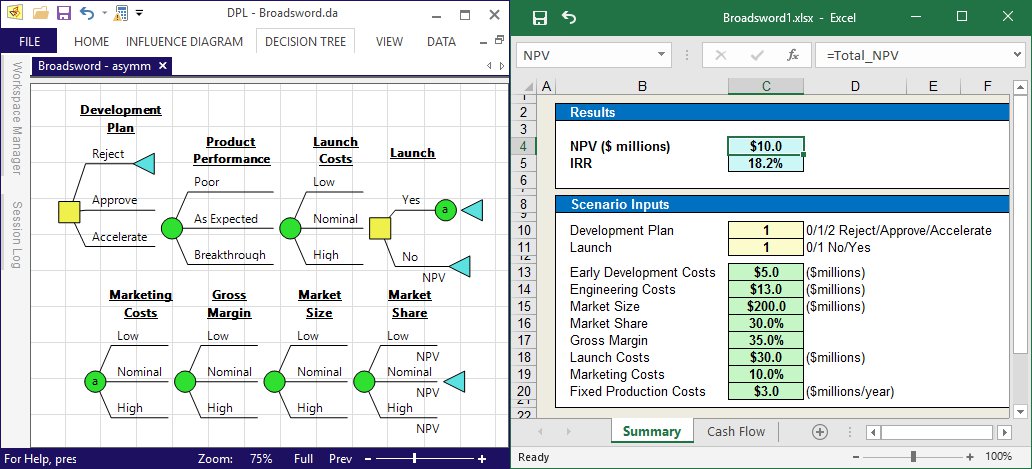
Imagine the following – a company is developing a new product scheduled for launch in 2018. You have been asked to review the project. Alternatives on the table include terminating the project, proceeding as planned and accelerating to reach the market one year sooner. You’ve been provided a discounted cash flow spreadsheet that calculates NPV for the proceeding as planned alternative using base case assumptions.
You can see that the value of the project with the current assumptions is $10M. Sounds like a winner, right? So, let’s move forward already…
BUT, as with any new business venture there are significant uncertainties surrounding costs and the commercial viability of the product if launched. The spreadsheet above is ill-equipped to quantify these uncertainties and value potential outcomes. I’m going to explain how one can easily take a rigid, deterministic spreadsheet such as this and easily transform it into one that flexibly and dynamically describes the problem at hand. It’s then just a few clicks to create a decision model in DPL that will analyze all of the possible outcomes in order to arrive at the decision alternative most likely to enhance value.
Download and take a closer look at the Excel spreadsheet highlighted in the blog post as you consider the following tips and best practices:
1. On separate sheet from calculations set up decision switches, assumptions, parameters, and output metrics.
Tip: This sheet should be high level, or at the same level as the decision tree, and free of excess detail.
2. The assumptions, switches, and metrics should be named cells.
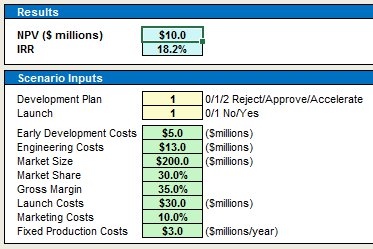
Tip: Be thoughtful and consistent with your range names to avoid confusion. Use a specific color code to distinguish decision switches, uncertainties, value metrics, and assumptions not linked to the decision model.
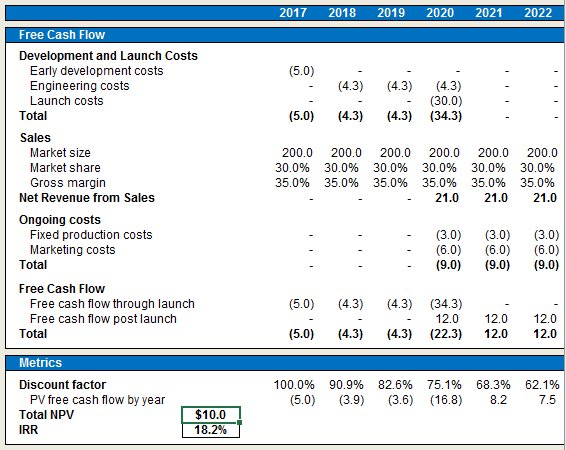
3. The Cash Flow calculations should flexibly depend on the assumptions, parameters, and decision switches.
Tip: Consider using range names rather than Sheet!Cell refs (=Assumptions!D14:M14) when data moves between sheets.
4. Employ the proper approach to multi-year uncertainties.
Often the key uncertain quantities in a decision problem are not single numbers, but rows in the cash flow model (e.g., Prices, CapEx). There are a variety of ways to model the uncertainty in such factors:
- A single multiplier can be used to move all the numbers up and down
- One or more growth rates can be applied
- A future quantity can be set with constant growth assumed (e.g., Price 2020)
- In case of delay, a row can be shifted out by one or more years (possibly with an escalation factor applied)
- Values can be conditionally changed (=IF(year>=ExpYr,Capacity2,Capacity1), etc)
- One of several possible rows can be selected via a flag
If you’d like to start incorporating robust analytic tools into your scenario analyses to ensure you’re making the best, most informed decisions for your business, I’d encourage you to request a Free 21-day trial license of the DPL software.