DPL 9 Release offers enhancements and features that serve to augment analytic performance, interoperability, scalability and intuitiveness
DPL 9 New Features
DPL 9 Release
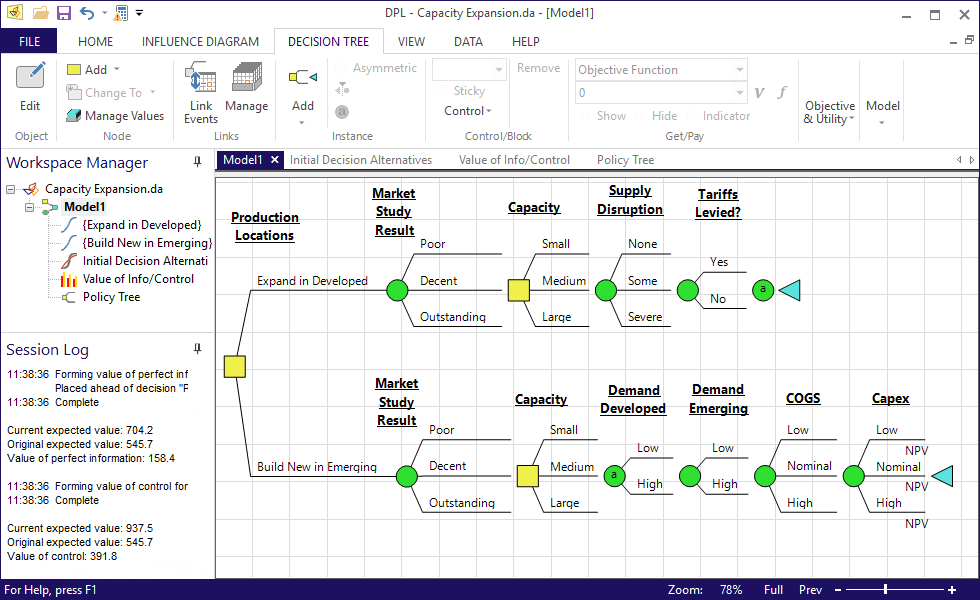
Decision Tree-focused Model
The major DPL 9 Release serves to underscore Syncopation’s commitment to providing analysts, consultants, managers, and analytic teams with an intuitive, graphical decision-tree based modeling environment for performing robust decision & risk analyses, Monte Carlo simulation, real option valuation, and portfolio prioritization.
For over 20 years, DPL has provided analysts with a set of tools that can help to:
Graphically describe, communicate and analyze complex decision-problems
Visualize downside risk, while maximizing upside potential
Increase stakeholder value in the face of uncertainty
Build a shared understanding among stakeholders in order to make smart, confident decisions
The DPL 9 Release includes a number of enhancements and features that serve to augment analytic performance, interoperability, scalability and intuitiveness -- bringing these crucial elements to a level that is simply unmatched by competitors in the space. Listed below are some of the new features by version:
More Flexible Modeling: Decision Tree or Influence Diagram Focused
Select which modeling mode you prefer: decision tree-focused, influence diagram-focused, or no preference (i.e., split halfway). Build your model entirely in the view you prefer.
Modeling Ease-of-use Improvements
Multi-select any object in the Influence Diagram or Decision Tree to make multiple changes at once. Manipulate the decision tree via streamlined and more intuitive use of the mouse.
Graphical Output Improvements
Exercise full control over the marker size in all charts and the percentiles and labels displayed in Risk Profiles.
New Time Series Percentile Chart
Visualize cash flow over time for all your initial decision alternative to gain a complete picture of how uncertainty evolves over time.
Selective Attributes:
Got a lot of attributes? With this feature you can slim down your Fat Policy Tree by selecting which attributes are displayed.
Perform a Subtree and Continue:
Just like it says – perform a subtree and then continue descending the tree with further events so you can define your decision problem with precision.
64-bit Executable
Exploit the scalability of the 64-bit Windows architecture.
.XLSX Conversion
DPL now does Excel XML: convert an .xlsx/.xlsm spreadsheet to a DPL Program for a huge performance boost.
Multiple-objective Functions
Who’s making that decision? Optimize multiple objective functions simultaneously within a single model to get a handle on the actions of partners and adversaries.
Parallel Endpoint Recording
Divide and conquer by running a large model on several different machines.
Allow Event Already Active
Need to model a decision-problem in which it’s most convenient to encounter the same event more than once on a path in the tree? (example: sequential oil well drilling decisions) Models these types of problems with ease by enabling the new “Allow event already active and halt with penalty value” feature.
Enhanced API and Improved Database Performance
Expanded functionality for embedding DPL in an automated decision support system and better database connectivity under the covers.
DPL does BIG Data
Estimate probabilities and discover conditional relationships to predict the target event so you can go from big data mining to making the big decision.
New Given Success and Subtree Attributes
Calculate key metrics given success and under other conditional scenarios automatically as part of a portfolio run.
.CSV Definition of Portfolio
When just defining the portfolio is half the fun, manage your list in Excel or another program and import it into DPL with just a few clicks.
Element Definition Based on SQL query
Dynamic project selection based on projects’ characteristics in the portfolio database.