Wherever you happen to live and whatever form your living space takes, if you own it you generally have to make a lot of decisions under uncertainty. I was faced with one this summer when I decided to install a solar array on the roof of my house in Maine.
Luckily, I had a roof whose pitch and direction were set up perfectly for a solar installation. Furthermore, I live in a state where there are some financial incentives for installing residential solar arrays. More specifically, these incentives include a 30% federal tax break and the ability to set up net metering with my utility company.
In my particular case, net metering would allow me to receive credit for 100%* of the value of the electricity generated by the solar array system against any electricity I consume during a 12 month period. We decided early on not to install a battery, and so, would not use the power generated from the array directly. The power generated was to be “sold back” to the grid. It should be noted that the value of the electricity I sell back to the grid can only be applied as credits to my electricity bill and cannot roll over to the next year so it doesn’t make financial sense to generate any more kilowatts than you intend to use.
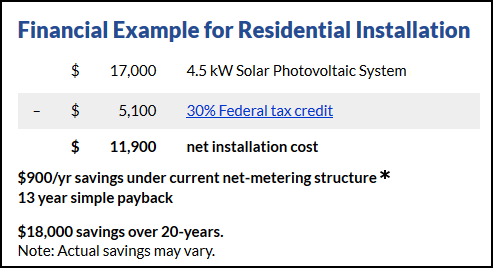
The figure to the right shows the breakdown of the costs, incentives, and potential savings for a typical residential solar installation in Maine:
(Source: https://www.efficiencymaine.com/renewable-energy/solar-electric/)
While the investment is long-term, it looks to be a sound one. So why am I blogging about my solar installation within this decision analysis blog? Well, did you happen to notice the asterisks up there? Earlier this year revisions to Maine’s net metering policies for residential solar customers were approved that grandfathered an existing customer’s (i.e. those with a solar installation completed prior to Jan. 1, 2018) rate for 15 years but slowly reduced new customer rates each year.
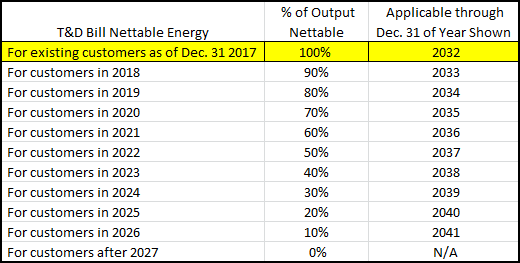
This shake up in the net metering rules is what prompted me to take action in the first place. The figure to the left shows how the new rules play out for current and future residential solar installations in Maine.
(Source: http://programs.dsireusa.org/system/program/detail/280)
Prior to this decision and since, there has been a lot of back and forth on Maine’s net metering rules. One side argues that solar technology is getting more affordable and so incentives should be decreased. While others feel they should remain in place – or even increased in order to bolster solar initiatives and business.
Though I’m technically “grandfathered” in at my 100% rate for 15 years, I do not trust the power that be in Maine to keep their word on this. We all know that policy and rules can change on a whim, no matter the promises made.
This may seem unrelated but I’m going to point out an obvious fact: it’s darn cold here in Maine for several months of the year. So heating your home, whether it’s by wood, oil, natural gas, electric heat pump, propane, or some combination, can be a costly and time consuming endeavor. I bring up it up because each of the price quotes we received from the various solar installers included an option for a larger solar array paired with a high-efficiency electric heat pump (See more on Heat Pumps here.)
At the time I already had three functioning heating sources: 2 large wood stoves and a relatively new #2 oil burning furnace (See more on Oil Furnaces here.) Why install another? Particularly one that cost upwards of $3,000 dollars?
We choose our installer who sent us a nice rate of return spreadsheet for the two options on the table:
- A smaller 4.275 Kw solar array with no heat pump
- A larger 5.45 Kw solar array with a heat pump (you’d install a larger array to cover the increase in Kw used by the heat pump)
So I have two decision alternatives on the table, a 30-year rate of return spreadsheet that includes all of the key parameters, and a healthy dose of political uncertainty to top it off. The situation begged for a DPL Model!
I made some edits to the rate of return spreadsheet: setting up decision switches, updating formulas, naming ranges, and incorporating a couple of extra columns to capture the political uncertainty piece. I ended up with this: Solar_Rate_of_Return_1.xlsx.
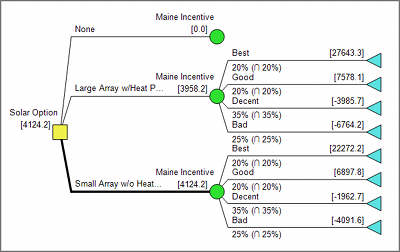
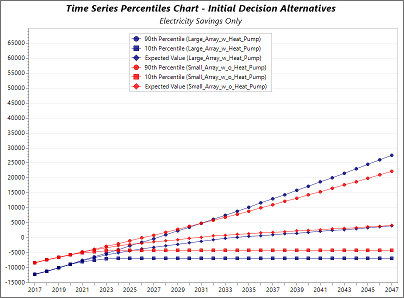
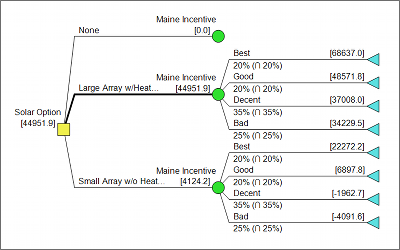
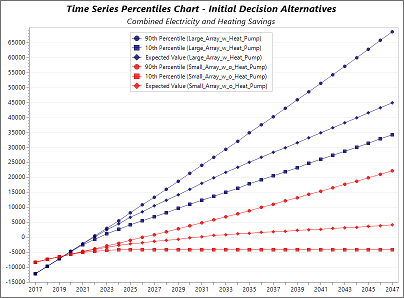
In DPL I created a simple model with just a couple of nodes linked to the spreadsheet: a decision for the solar installation alternatives, a discrete chance node for the Maine solar incentives (best, good, decent, bad) and the output metric to be maximized, Total Savings. I thought it would also be interesting to see how savings accrued over the 30 year period so I set up a value node for the cash flows and defined 30 attributes (one for each year) and updated my get/pays so I could generate an Initial Decision Alternatives Time Series Percentiles chart.
The Policy Tree and Initial Decision Alternatives Time Series Percentiles Chart are show to the right.
I know that doing my part in decreasing greenhouse gas emissions and lessening our dependence on fossil fuels should be the motivating factors behind this installation but I was disappointed to see that the potential windfall of savings was severely hampered by the inclusion of political uncertainty. The Policy Tree indicates that we’d save a few thousand bucks over that 30 year span and should go for the smaller array without the heat pump – though barely.
My husband was still championing the larger array with the heat pump, which I had almost immediately written off as a superfluous up-sell on the installers part. Then I had an epiphany. Recall what I said about the expense of heating homes in Maine. This electric heat pump/solar array duo is essentially free heat – the savings for which are not incorporated into my spreadsheet. So I did a little research in order to find out how much it costs to heat one half of my house with #2 oil in a year and incorporated those additional savings plus the expense and maintenance cost of the heat pump into a new version of the spreadsheet: Solar_Rate_of_Return_2.xlsx
I duplicated my model, updated the spreadsheet links, and ran the model again. The results were immediately more eye-pleasing. The optimal decision policy, by a long shot, was now the larger array with the heat pump. The heat pump serves as a substantial buffer against the uncertain political landscape surrounding future solar incentives and net metering. I’m always going to need to heat my house and, if anything, heating oil prices will likely only increase in the future.
The results of the model with the inclusion of the heat savings are to the right. Feel free to download the DPL 9 workspace that contains both models in order to take a closer look: Maine_Solar.da
So what did I take away from this exercise?
- Sometimes, but still rarely, your partner is actually right
- One should never dismiss an alternative before fully analyzing it’s potential value
- Never blindly trust the numbers you see on a deterministic rate of return spreadsheet, particularly when they are based on policy that can change in an instant
- It feels good to go green (and save money)!
- Not everyone who considers a residential solar install builds a DPL model – the confusion and uncertainty surrounding the rule and incentives for Maine Solar is unfortunate and serves only to impede the adoption and growth of solar initiatives in our state! Get it together, Maine!