We’ve discussed “Big Data” within our Imperfect Information blog in the past – with a moderately critical tone. (See Big Data and DA) When it comes to Big Data us DA folks think far too much emphasis is put on the past and how many terabytes one can unearth and not the value (or lack thereof) that the wodges of data can bring to your decisions. So allow me to expound the fact that data (or information) only has value if it will affect your future actions and decisions! (See Reflecting on the Value of Cheap Information).
I think INFORMS recently put it best with their recently published blurb on the best definition of analytics (Source). INFORMS defines analytics as:
the scientific process of transforming data into insights for the purpose of making better decisions.
So, what’s my point? We recently added some innovative, new capabilities to DPL that will help users with these wodges of data move swiftly from analyzing datasets to analyzing decisions that will lead to confident action.
The probabilities for chance nodes in a DPL model can come from a variety of sources. When the uncertainty is a one-of-a-kind, truly unique event, and no structured data is available, probabilities are often obtained by direct subjective assessment by an expert in the subject matter.
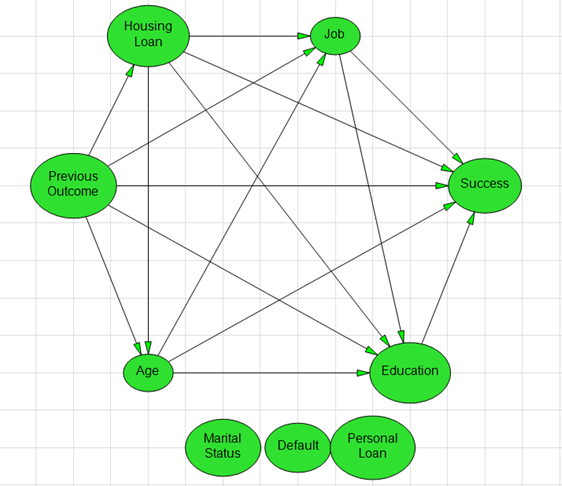
When structured data (i.e., “big data”) is available, DPL can employ it’s “Estimate Probabilities from Data” capabilities in order to infer probabilities and probabilistic relationships (i.e., Influence Arcs in the Influence Diagram, see image to the right) for a data set consisting of a number of outcome observations (rows) for two or more uncertain events (columns). Pairing classic “data mining” tools and processes with DPL’s intuitive Decision Tree/Influence Diagram modeling interface allows users the flexibility to be pragmatic with their analyses. Read on to see how this plays out in a “real-world” case.
The Bank Marketing Case
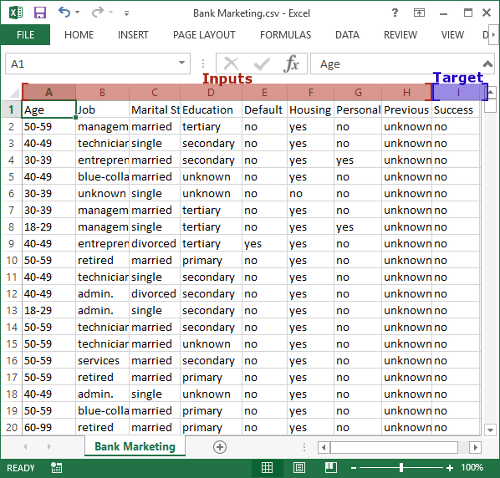
All DPL 9 licenses ship with an example .CSV dataset that is made up of observations from a direct bank marketing campaign [1] (shown right). Bank customers were contacted and offered a subscription to a bank term deposit. The dataset contains 9 columns of data – the first 8 of which are inputs in the form of bank customer information, current loan status, and the outcome of a previous campaign. The 9th column contains data for the target event: whether or not the bank customer subscribed to a bank term deposit (yes or no). The dataset includes over 45,000 rows or observations of the target event. Feel free to download it and take a closer look:
It costs the bank money (e.g., sales staff time) to initiate contact, market, and sell products to existing customers. The goal of bringing together the dataset and DPL is to identify the set of customer inputs that are the best predictors of campaign success (i.e. subscribing to a term deposit) in order to make better decisions within the campaign.
In addition to building a better understanding of the dataset, DPL’s Decision Tree analysis capabilities provide you the ability to explicitly add decisions (Should we sell a subscription?) and other key variables to the model (Costs, Profit) so you can develop a set of decision rules based on the relationships you’ve uncovered in the data.
Armed with these tools, the bank will be able to direct resources to the customers most likely to buy, enhancing customer relationships by offering the right products to the right people and boosting the efficiency and overall success of the campaign.
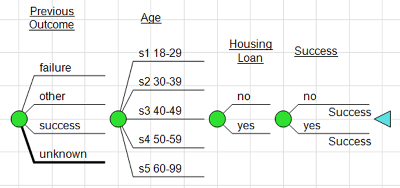
Earlier I noted that you can be more pragmatic within your analyses with a Decision Tree in hand. For example, in the tree below you may want to see the Age variable come before the Housing Loan because that’s what makes most business sense. This can be done through a simple re-order of the Decision Tree. Through a technique called Bayesian Revision DPL will automatically flip the arcs in order to calculate the probabilities correctly within the rolled-back tree.
We’re honest about the fact that DPL is still a decision analysis tool (not a first-in-class data mining tool), so let’s talk about the decision. Once you’ve got a handle on the input variables that matter – you can add a decision to the model. In the Bank Marketing case we would first add a couple of value nodes to the model: one for the cost of selling the product and another for the profit if successful. Then we can add a “Sell?” decision and place the get/pays (costs and profits) in the appropriate places in the tree.
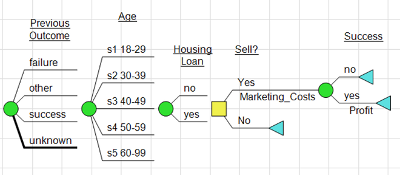
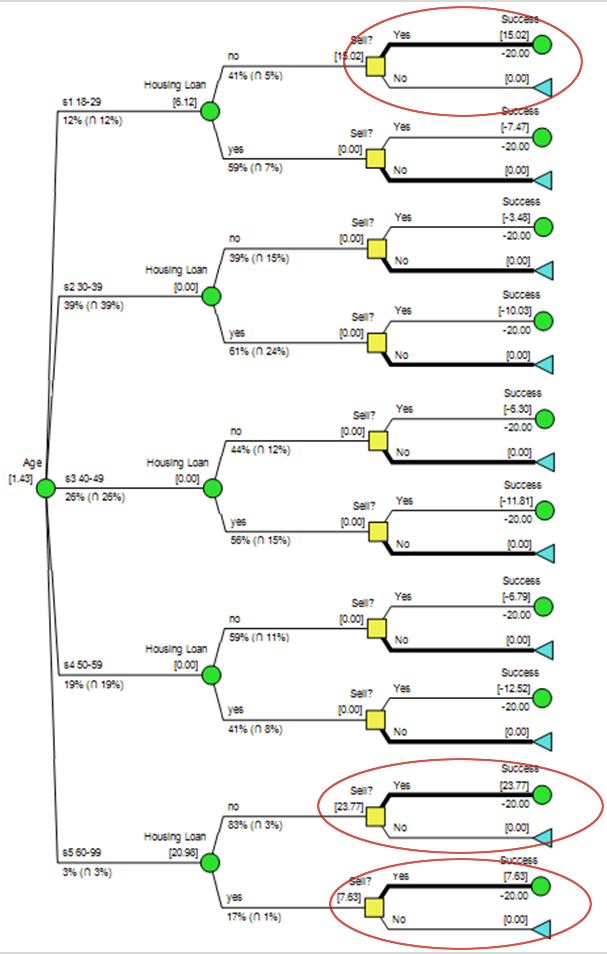
The Decision Tree below can be thought of as a representation of a single customer/CSR interaction within the campaign. The goal of the decision analysis is to reveal a decision policy that can be applied to all customer interactions.
The Policy Tree output (right) pointed to a couple of scenarios in which the CSRs should attempt to sell the term deposit. The banking institution could leverage this policy by flagging the subset of customers that fit this particular criteria within the customer management system so that the CSRs know who to sell to.
Here is the full DPL model that was generated from the dataset:
[1] [Moro et al., 2014] S. Moro, P. Cortez and P. Rita. A Data-Driven Approach to Predict the Success of Bank Telemarketing. Decision Support Systems, Elsevier, 62:22-31, June 2014.