Every DPL model is a combination of an Influence Diagram and a Decision Tree but I admit that we tend to play up the decision tree side of our software, as it is the analytic backbone of the DPL software. Furthermore, as a marketer, I’m also vested in search term prominence. See how the two terms compare in Google Trends.
Are Influence Diagrams less important or less hip than their tree counterpart? Perhaps. Should they be deemed unnecessary and thrown to the wayside? Certainly not. In fact, I’d like to use this opportunity to highlight the role the Influence Diagram plays and the value it can bring to decision modeling. There are two main motives for using Influence Diagrams in decision modeling, particularly when decision trees are also in the mix:
-
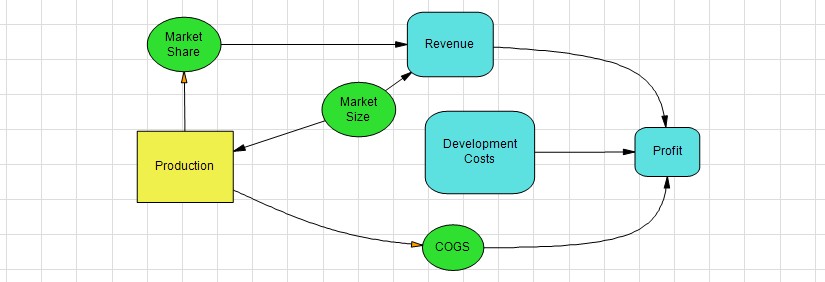
Decision framing: An Influence Diagram can be thought of as the whiteboard of a decision-problem. They depict the main factors, represented by nodes, and the relationships between those factors most relevant to the decision. Simple, compact, and easy to display, all you need are identifiable shapes for the decisions, uncertainties, and values nodes and some choice arrows between them to show relationships. If you’ve got a scratch pad and a pen you’ve essentially got all you need to create a basic influence diagram. Added bonus: no analytical or mathematical experience is needed, anyone who has a stake in the decision will understand what the Influence Diagram represents.
-
Dependence/Conditioning: While a decision tree is excellent at conveying the overall structure and timing of the decision-problem, it simply cannot efficiently display the conditional relationships between factors. The advantage here goes the Influence Diagram within which you easily specify timing, dependence, and conditioning. In DPL we make it easy to decipher between these relationships by color-coding our arrowheads.
Decision trees are a powerful tool, but can be unwieldy, complex, and difficult to display. (Hint: ugly trees come from people who avoid using conditioning in the Influence Diagram.) When complemented by an Influence Diagram, you’ve got a powerful combination for aptly visualizing and analyzing the decision problem. If you’d like more detailed information on using Influence Diagrams to analyze a simple, strategic business decision in the DPL 8 Professional software, please watch this short video tutorial: