As a market leader in decision analytic tools, we confidently stand by our claim that DPL is the most powerful, full featured application for decision tree and influence diagram modeling on the market today. DPL offers a dedicated, standalone graphical modeling interface for performing decision and risk analyses, Monte Carlo simulation, and Real Option valuation. The tool’s flexibility and intuitiveness allow you to model the characteristics specific to your decisions with a precision unmatched by our competitors.
There are many business tools on the market that are simply ill-equipped to handle the breadth, depth, complexity and pace of decisions that characterize today’s business environment. We’re frequently asked how our DPL software stacks up against our various competitors so allow me to break it down for you:
All-in-One Convenience
All DPL versions offer the fundamental decision modeling tools you need:
- discrete tree modeling
- continuous modeling (i.e., Monte Carlo)
- real option valuation,
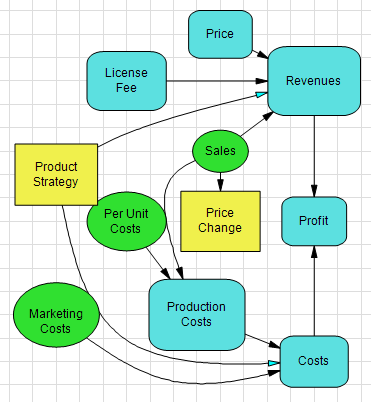
- Influence Diagrams,
- Decision Trees,
- Complete range of insightful, presentation ready results,
- Sensitivity Analayses,
and much more – with no limits on the number of variables all within a single package!
Some of our competitors divvy up these basic decision modeling features into separate, standalone products that must be purchased piecemeal. If you need the whole enchilada you’ll need to purchase the full “suite” of product… at a premium. Oh, and if you don’t want any limitation on your modeling – that will be another hit on your wallet. With our competitors you’ll end up having to juggle more software licenses and spend more of your precious budget dollars to get all of the features you need – without limitations.

OR
No Need to Re-invent the Wheel
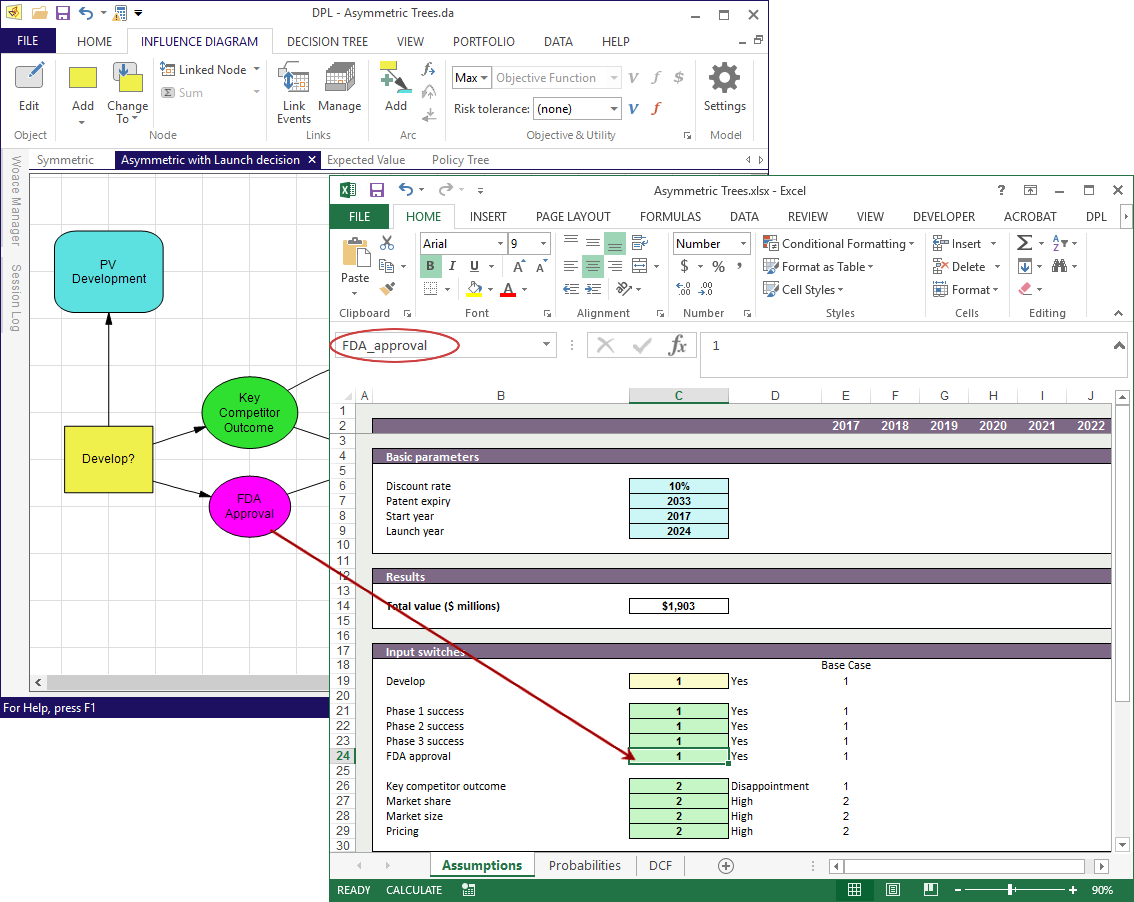
We can all agree that Excel is the environment that we’re all comfortable and familiar with for doing financial calculations. Some of our competitors either tell you you don’t need Excel or provide spreadsheet linking as an afterthought. DPL’s extensive Excel linking capabilities means there is no need to re-invent the wheel as far as your financial models are concerned. User’s familiar with building spreadsheet models can continue to work in that medium – simply build your financial/DCF models in Excel, build the decision model in DPL and then link the two together to conduct a robust analysis. Or better yet build your financial models in Excel and have DPL build a decision model for you from the spreadsheet!
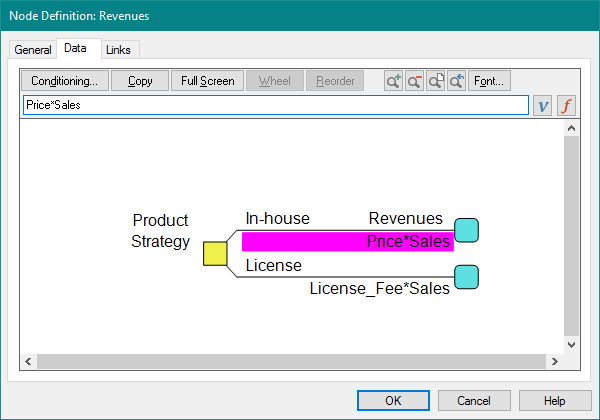
Further, DPL has a whole suite of built-in mathematical functions that can be employed to define your value model. In fact, most financial functions that you would use in a spreadsheet are available in DPL. Simply put DPL offers up the best of both words: a full featured graphical modeling interface and the familiarity of Excel for dealing with data and financial calculations.
Analytical Power that is Second to None
DPL is built for speed and can handle large “real-world”-sized decision problems with excellent performance. We’re talking models with thousands even millions of endpoints! The number of variables included in an analysis is limited only by memory. Our competitor’s products simply cannot (or at least not with the same ease) deal with these sized models. We understand that the dynamics of business decisions today are complex and ever-changing and DPL provides a robust set of tools and proprietary optimizations to tackle these problems with efficiency.
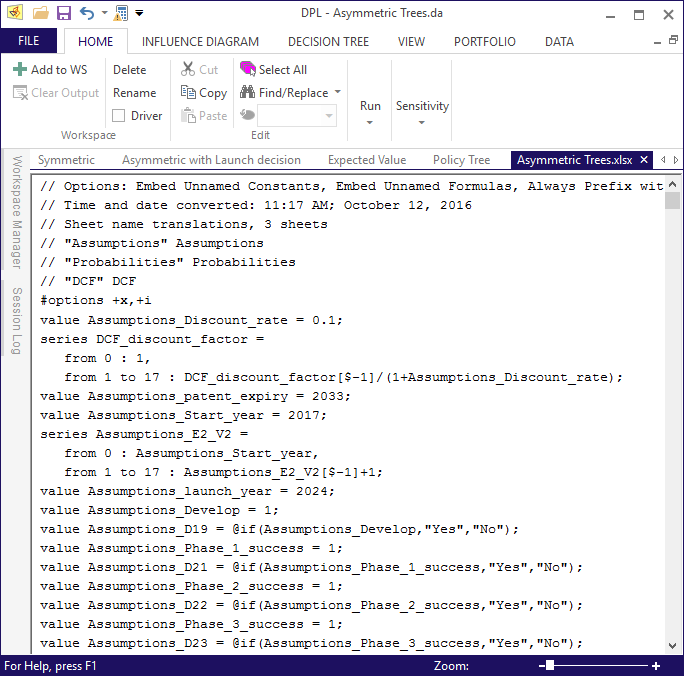
One feature that is unique to DPL is its ability to convert Excel spreadsheets to its native expression language, dramatically boosting performance – typically by a factor of 10 to 100!
When it comes to Scalability – the Sky is the Limit!
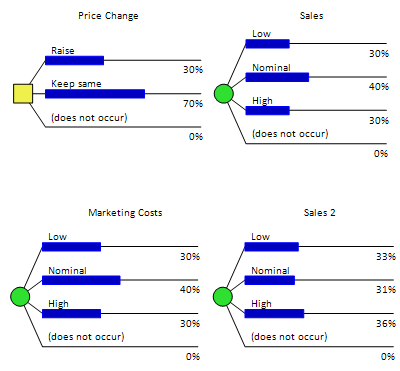
DPL offers users a high level of scalability and ease of modeling by separating its input and output trees. In this way the input decision tree is compact, easy to display and a breeze to manipulate. Values, probabilities, and conditioning are all specified as part of a variable’s definition rather than added as clutter directly on the input tree.
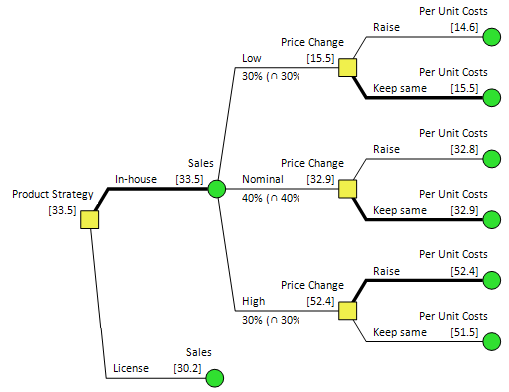
As you build out the model, you run a decision analysis in order to generate a complete, unfiltered output tree: the DPL Policy Tree™. This key result is a is a “strategic road map” for making decisions and managing value going forward. Each path of the Policy Tree™ is a specific scenario of the model.
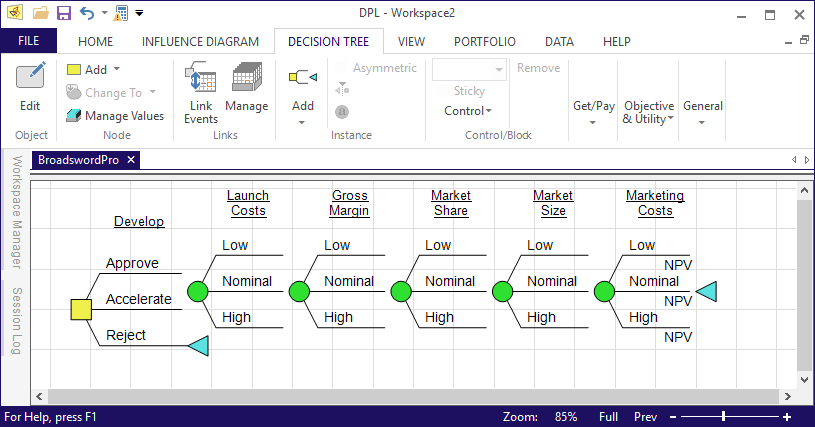
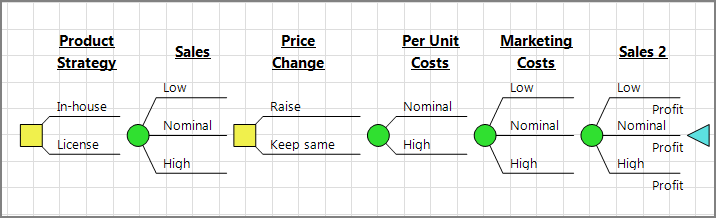
By maintaining this separation you are able to model virtually any business decision problem in DPL without the tree being an unwieldy, bushy mess! Below is a simple input decision tree for a New Product Development decision that has 6 events and 487 paths built in DPL (using schematic notation) vs. this same input tree as built within a competitor’s Excel Add-in application. Which would you rather work with?
Symmetric Input Tree in DPL
VS
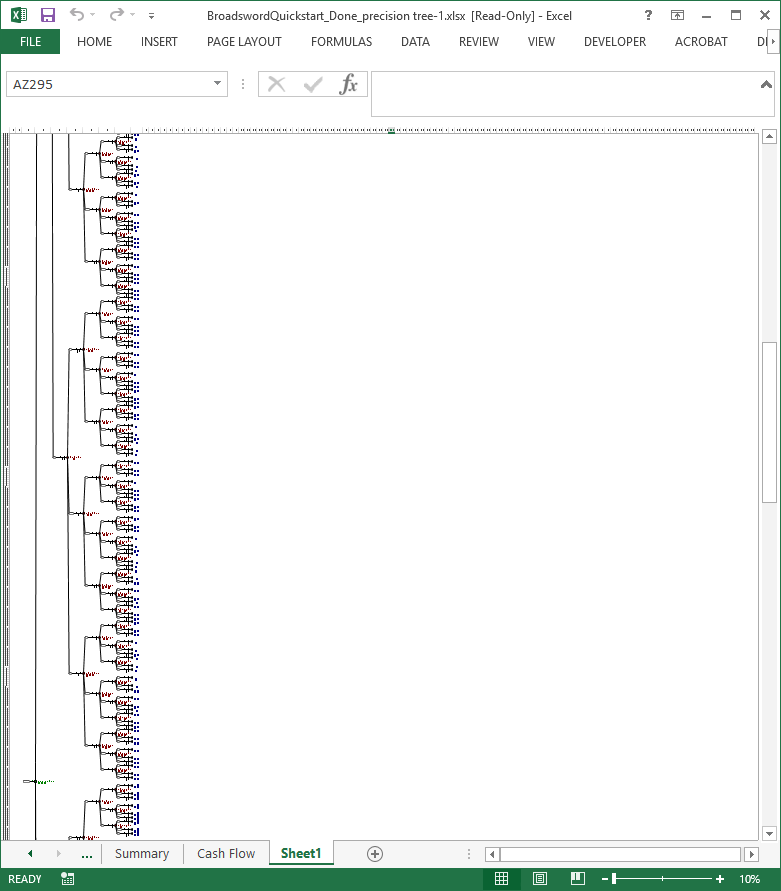 Same, Symmetric Input Tree in Competitor’s Too
[Sorry – even with Excel at it’s lowest zoom level the whole tree will
not fit in the screenshot]
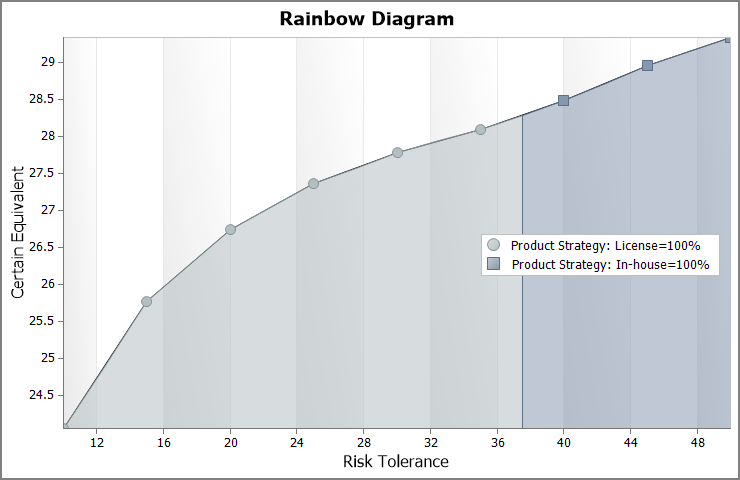
Avoid Communication Breakdowns
DPL offers all the essential decision analytic outputs you’d expect via attractive, presentation-ready charts. In addition, each output can be copied and pasted as a metafile to Powerpoint for further manipulation if necessary. Lastly, the data underlying the output can be exported to Excel if you wish to make a custom chart presenting the data differently.
Taken together the DPL model and DPL results combine to provide the perfect means to effectively communicate to stakeholders how risks, value, and options play out over time. You can answer key questions like:
Which factors are treated as uncertainties in the decision problem? And, how are they related to one another?
What is the timing and structure of the decision events?
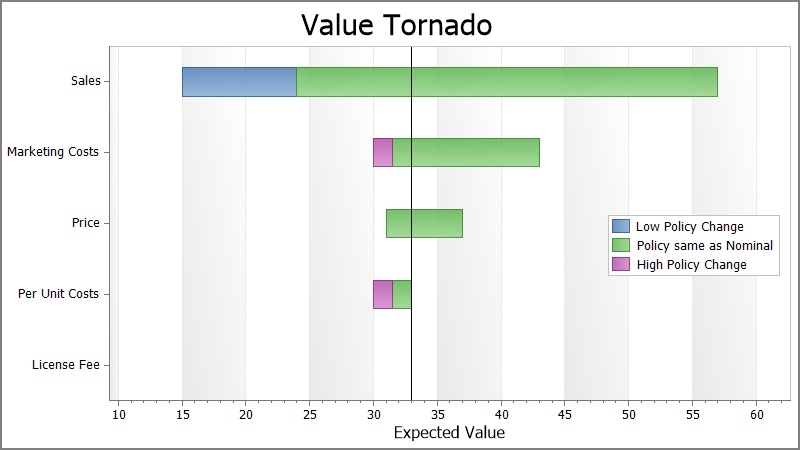
Which factors have the most impact on value and decisions?
What is the best decision policy – now and in the future?
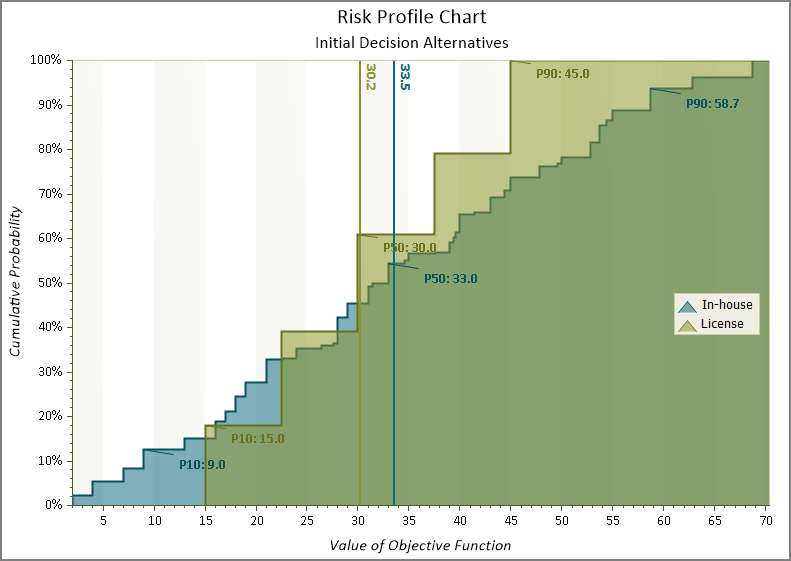
What are the risks involved for each decision alternative?
How robust is our decision policy?