This blog posts describes various steps that may be taken to validate
that a DPL/Excel model is computationally correct. The actual
testing/validation required will depend on the particulars of your model
and the circumstances of the analysis. Accordingly, this is more of a
menu one can pick and choose from rather than a checklist. If you use
other methods not listed, and they may be generally useful, please add
them in the comments section below.
One thing to keep in mind – model validation is an exercise in value of
information. One can never be 100% certain that a model contains no
errors. A model has been validated when the risk of a material (~=
decision sensitive) error is acceptable given the stakes of the decision
and the cost ($ and time) of further validation.
1. Basic Model Run
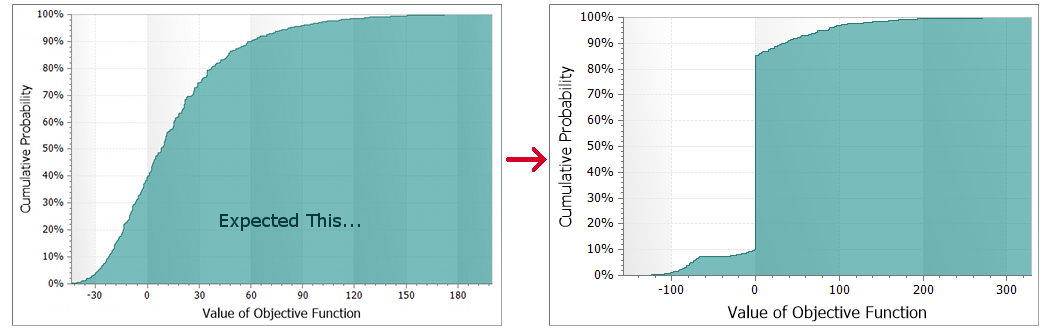
It is a good sign if the model runs, but you should also scan the
results for:
- unexplained vertical or horizontal lines in the risk profile
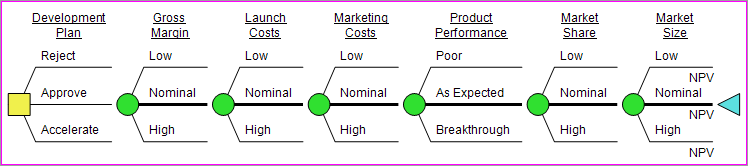
- “ties” where decision/chance states all produce the same expected
value (usually an indication that something is unhooked)
|
2. Test Reasonableness of Scenarios
- Branch control all uncertainties to their base case and run an
analysis. Check that the expected values agree with those in the
spreadsheet for the decision combinations
- In the spreadsheet, change several uncertainties and make sure the
value moves in the right direction
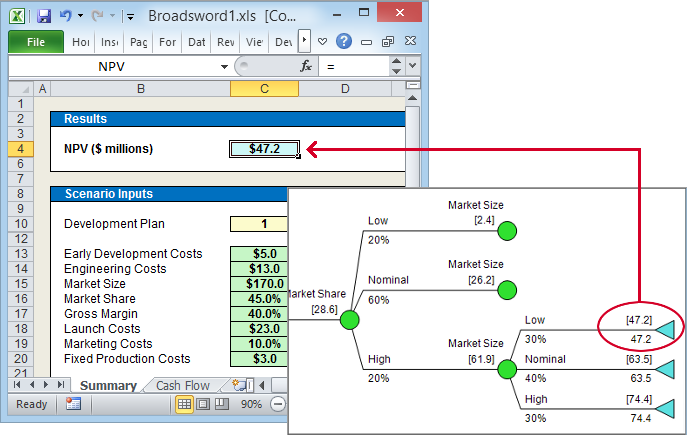
- Choose several different scenarios, drill down the policy tree to
find the value (NPV) for each one; compare with the spreadsheet for
that scenario and inspect the cash flows and other main results in
the spreadsheet for each one
|
3. Directional Testing
- Control as in 2a then uncontrol one uncertainty at a time and
re-run, making sure the results move in the right direction. And
then do the reverse – uncontrol all uncertainties and control them
one at a time for each run
|
4. Range check Excel model
- Add formulas to the Excel model to verify range conditions (e.g.,
sales volumes >= 0, percentages between zero and 100%, summing to
100%, mutually exclusive alternatives not both chosen, etc)
- Make the main value return an error if the ranges are violated. For
example, the formula for DPL_NPV could be =IF(QACheck=0, NPV,
#N/A)
|
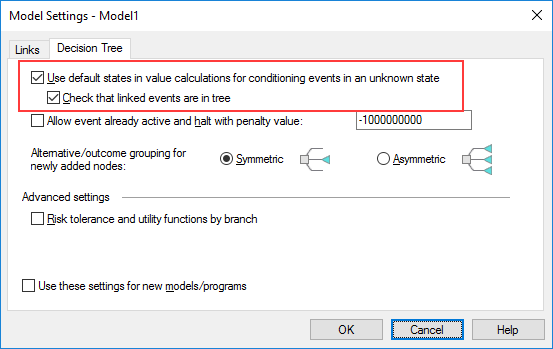
5. Ignore Conditioning Unknown State Setting
You may have developed your Excel model such that if certain decision
alternatives are selected then the spreadsheet ignores certain input
variables. If you then build an asymmetric tree and do not want DPL to
check for dependencies based on the influence diagram, you should have
the Tree-based dependency checking option turned on.
DPL still sends values for nodes (the Default state for uncertainties)
that are skipped in an asymmetric tree. So you must ensure the Excel
spreadsheet is coded so that events that are omitted on some of paths of
the tree don’t matter on those paths. To verify this
- For each event that is omitted, inspect the spreadsheet formulas and
make sure that they logically isolate the input for the omitted
event in the scenarios where it is omitted
- Turn off “tree-based dependency checking”. Add branch controlled
tree instances to the “short” paths to make the model compile. The
added instances should be controlled to a branch other than the
default. Make sure the results are the same.
|
Second Pair of Eyes
Have the other person:
- inspect the Influence Diagram and Decision Tree, including node
values and get/pays
- inspect all the formulas in the spreadsheet or at least those
sections touched by the DPL switches
|