Life Science
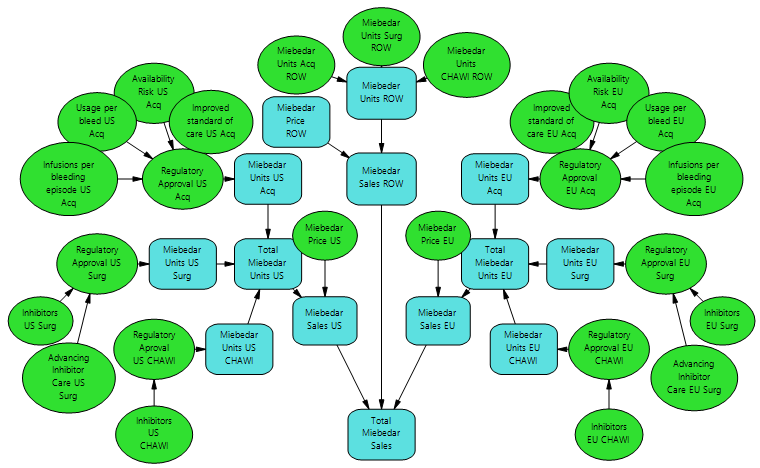
Regional Sales Forecast - Influence Diagram
You may have noted from the screenshot above that this atypical DPL “decision model” is in fact, decision-less! The model represents a sales forecast for Miebedar, a new pharmaceutical drug in development, and incorporates uncertainties surrounding dosing and usage within various therapeutic areas in order to come up with a projection of units sold per region. Units are then multiplied by a pricing uncertainty for each region to result in a forecast of Total Miebedar Sales.
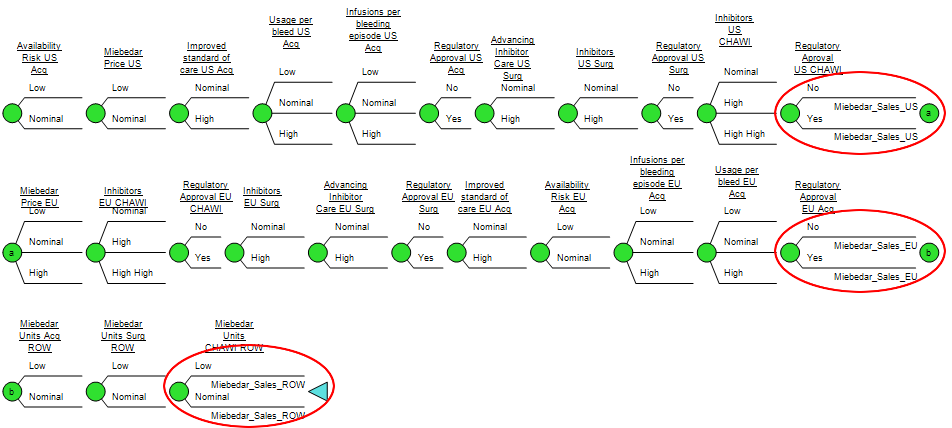
In this example model only a single output metric, Total Miebedar Sales, is of interest. But instead of placing this value as the get/pay at the end of this rather large, symmetric decision tree – totals sales are broken into component values and moved up in the tree (a process we call “promoting get/pays”, shown below). Doing so allows DPL’s proprietary optimizations pick apart and calculate the decision tree, one that boasts over 500+ million paths, in a matter of seconds!
Life Science
Regional Sales Forecast - Decision Tree