DPL is an intuitive, easy-to-use decision tree modeling environment that offers a comprehensive set of robust decision framing and analysis tools. These combined with reliable Excel spreadsheet links provides you with the insights necessary to make the most informed decisions for your business.
Decision Problem Framing
A DPL model is a unique combination of a Decision Tree and an Influence Diagram, allowing you the ability to build scalable, intuitive decision analytic models that precisely reflect your real-world problem.
Decision Trees
Articulates the formal structure and chronology of how events will unfold over time
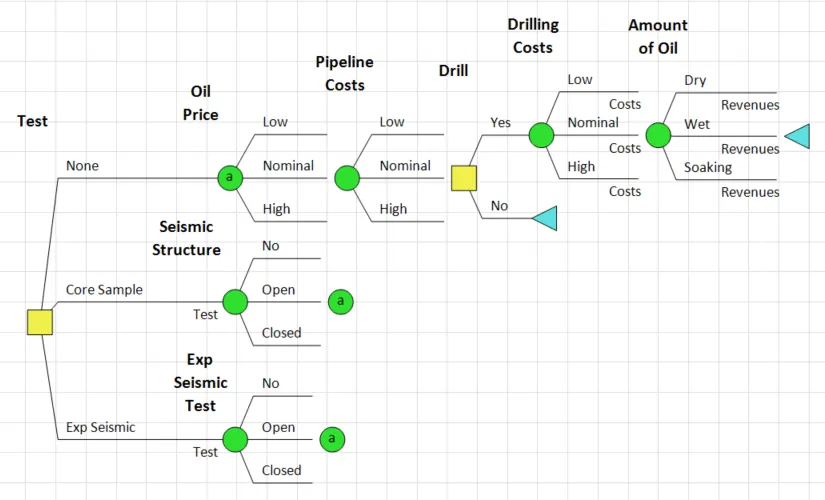
DPL Decision Tree
A Wildcatter’s Decision
Influence Diagrams
Depicts the main factors and the relationships between those factors most relevant to the decision
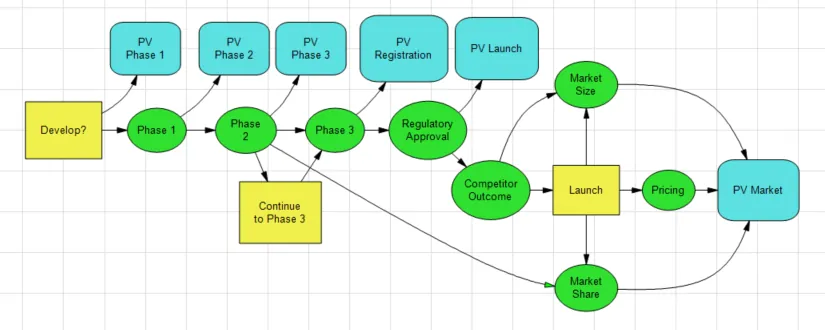
DPL Influence Diagram
An Early Stage Drug Development Decision
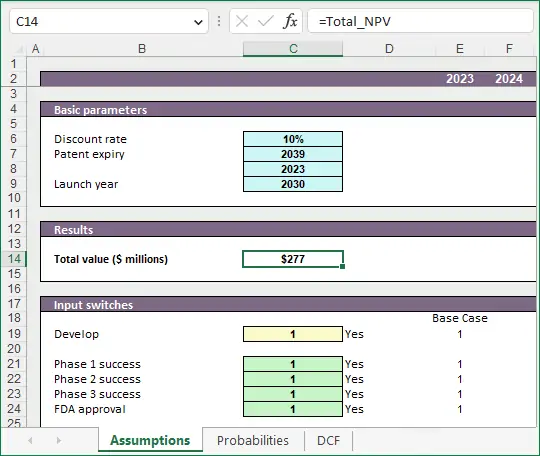
Excel Spreadsheet Linking
DPL is a standalone application that also integrates closely with Excel, providing the best of both words: a full featured graphical modeling interface paired with a familiar Excel environment that can efficiently deal with data and financial calculations.
You can build your decision tree model first and then set up Excel links or quickly build a DPL model from an established cash flow spreadsheet in just a few clicks. You can also create a local DPL model by keeping all the calculations wholly within DPL. It’s up to you!
Sensitivity Analyses
You can easily build a DPL model from an Excel cash flow spreadsheet. Starting with this basic model you can conduct sensitivity analyses to determine which variables have the biggest impact on value and decisions.
Through several types of tornado diagrams, DPL can help you build insight and prioritize your focus on what matters most.
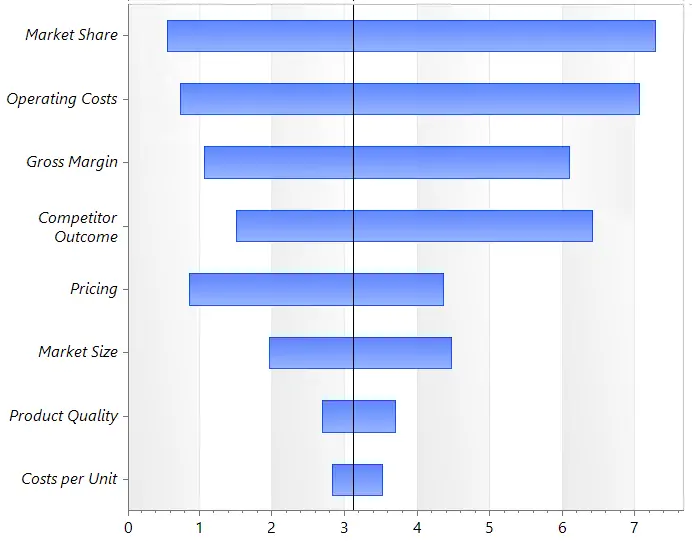
DPL Tornado Diagram
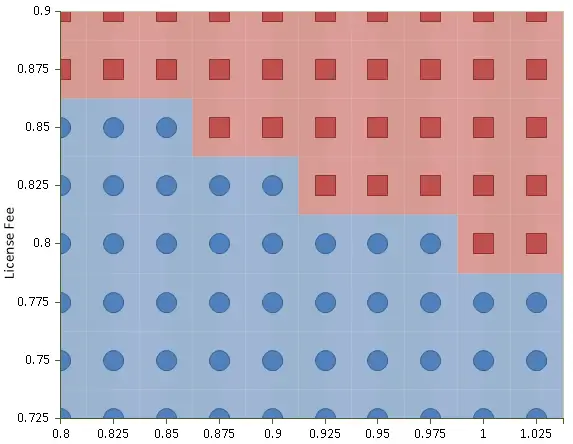
DPL Rainbow Diagram
DPL Results & Outputs
We understand that a model will only lead to action if the results can be understood and explained to the project team and stakeholders – which is why DPL offers a broad range of attractive and presentation-ready results that will provide you (and laymen) with maximum insight. These include but aren’t limited to:
- Policy Tree: an unfiltered output tree that identifies the winning strategy and provides a complete picture of all the possible scenarios of the model
- Risk Profiles: also known as a cumulative probability distribution, the Risk Profile output visually describes the range and likelihood of outcomes in your decision model
- Value of Information/Control: Understand how much you should invest in further research, how much value there is in delaying a decision or the value of putting control systems in place
- Endpoint Database: Record and save endpoint values in order to conduct “what if” sensitivity analyses without having to re-run the full model.
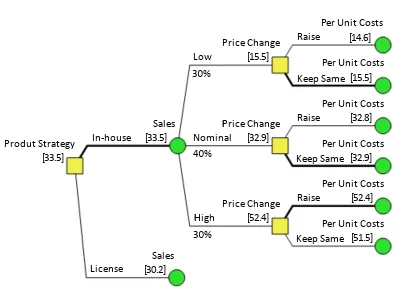
DPL Policy Tree
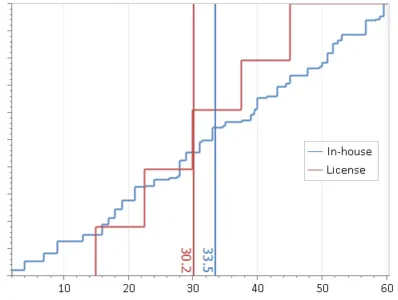
DPL Risk Profile
Who uses DPL?
DPL isn’t designed for a single industry vertical or decision-problem. For over 25 years DPL has been helping industry leading organizations make profitable decisions within a wide variety of industries, including Pharmaceutical, Oil & Gas, Electric and Utilities, Consumer Products, Mining & Energy, and the Aerospace and Defense sectors.

Valued DPL Customers
BEST-IN-CLASS DECISION TREE SOFTWARE
DPL 9 is an intuitive, graphical decision tree software providing insights that lead to better decision quality. Maximize the value of your investments through smart, calculated decisions with high returns and well-understood risks.