DPL offers an easy-to-use decision modeling environment that incorporates key decision framing tools – Influence Diagrams and Decision Trees – with Excel spreadsheets to help you enhance decision quality at your organization. It is a comprehensive solution that supports the entire decision making process from decision framing to confident action.
Today’s business professional’s can no longer depend on rules of thumb or conventional business tools for handling the complexities of today’s business decisions. DPL offers powerful analytic tools for building decision tree models that precisely reflect your real-world decision-problem. It is a solution that supports the entire decision analysis process:
Decision Problem Framing
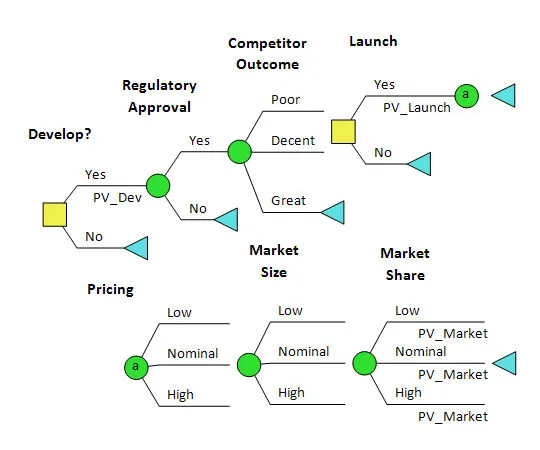
Framing a problem correctly is the key to a successful analysis. DPL’s Influence Diagram can be thought of as the whiteboard of a decision-problem, depicting the main factors and the relationships between those factors most relevant to the decision. They are the perfect complement to the Decision Tree, which articulates the formal structure and chronology of how the decisions and uncertainties will unfold over time. These two tools are tightly integrated, so you can make use of the strengths of each as you build your decision model.
A DPL model is a unique combination of a Decision Tree and an Influence Diagram, allowing you the ability to build scalable, intuitive decision analytic models that precisely reflect your real-world problem.
Decision Trees are a powerful tool – but can be unwieldy, complex, and difficult to display. When complemented with an Influence Diagram, you’ve got a powerful combination for aptly visualizing and analyzing virtually any decision problem.
Influence Diagrams
depicts the main factors, represented by nodes, and the relationships between those factors most relevant to the decision

Decision Trees
Articulates the formal structure and chronology of how the decision and uncertainties will unfold over time
Excel Spreadsheet Linking
DPL provides extensive and flexible linking support for Excel – you can build your model first and then set up Excel links or quickly build a DPL model from your Excel cash flow spreadsheet. During an analysis, DPL exports data to Excel input cells (assumptions and switches) for each scenario in the decision model and tells Excel to re-calculate. DPL imports results back from Excel output cells (formulas, calculated quantities) and accumulates the results for the outputs you request.
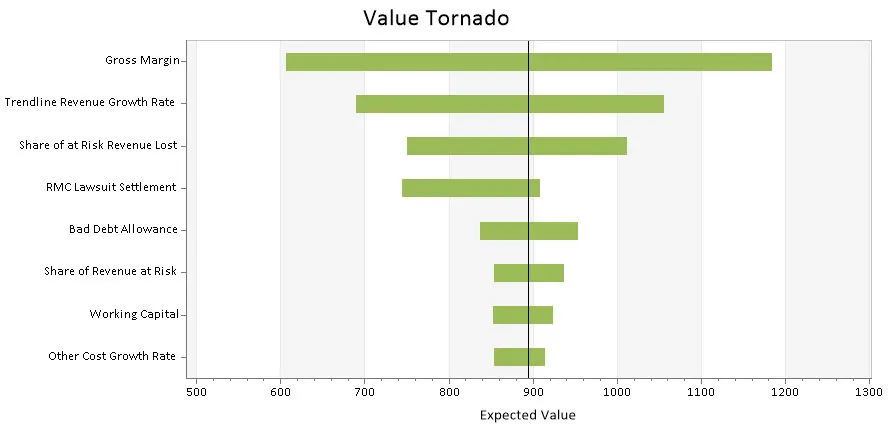
Sensitivity Analyses
Often the first step in a successful analysis is to perform a sensitivity analysis – one that shows the relative importance of the value drivers. DPL offers a variety of graphical sensitivity analyses options that provide you with the insight necessary to prioritize your focus on what matters most.
DPL’s Tornado Diagram’s show the effect of varying inputs on the decision objective. For a more detailed sensitivity analysis DPL also offers one and two-way Rainbow Diagrams.
Communication of the Results
No analysis will lead to action if the results can’t be understood and explained to the project team and other stakeholders. DPL Professional provides a broad range of outputs to give you maximum insight into the results. DPL outputs are attractive and presentation-ready by default but are also easy to customize within DPL or when copied to other applications, such as PowerPoint.
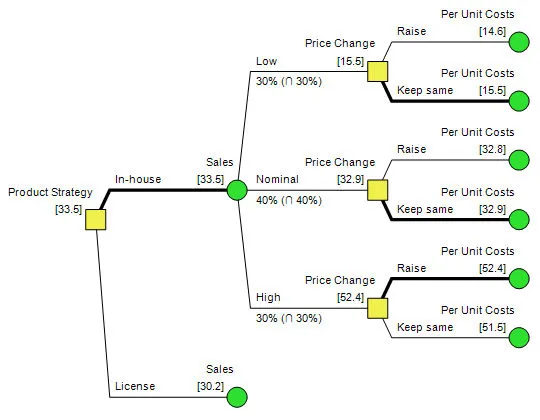
Policy Tree: an unfiltered output tree that identifies the winning strategy and provides a complete picture of all the possible scenarios of the model. It can be leveraged as a strategic road map for making the best, most-informed decisions and managing value now and in the future.
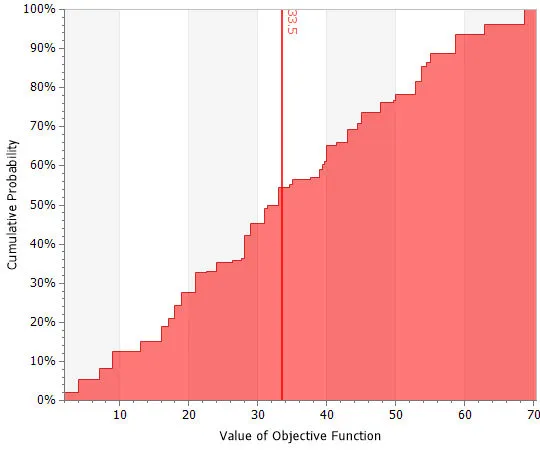
Risk Profile: also known as a cumulative probability distribution, the Risk Profile output visually describes the range and likelihood of outcomes in your decision model. Multiple Risk Profiles datasets can be compared within a single chart so you can better understand the relative risks of your decision alternatives.
Why is a Decision Analysis approach better?
Decisions: Decisions with specific alternatives are modeled explicitly in DPL. An analysis indicates the optimal decision policy for up-front and downstream decisions.
Uncertainty: People have more intuition for outcomes than for variance, skewness, etc. In DPL, uncertainties are modeled with discrete outcomes for which probabilities and values are explicitly defined.
Value of Information (VOI): The importance of an uncertainty and the value of learning more about it can be calculated by DPL automatically. VOI has relevance to real world actions and can be used to determine when to move forward.
Dependence: Probabilistic and value-wise dependence are specified explicitly and are visually apparent within the influence diagram. Other tools offer less direct approaches, such as correlation coefficients, for which most have little intuition.
To learn more about the advantages of a Decision Analysis approach as compared to Monte Carlo see: The Decision Analysis Advantage
What types of decisions is DPL used for?
With its intuitive user interface and the most powerful analytics engine on the market, DPL is the platform of choice for everything from simple risk analyses to the most complex, high stakes business decisions. Typical decision applications include, but aren’t limited to:
- New Product Development
- OpEx Planning
- Mergers & Acquisition/Divestitures
- Infrastructure Planning
- Risk Management
- Capital Investment Strategy
- R&D Prioritization
- Market Forecasting
See how DPL is leveraged to make good decisions and solve real world problems:
BEST-IN-CLASS DECISION TREE SOFTWARE
DPL 9 is an intuitive, graphical decision tree software that provides insights that lead to better decision quality