The humble tornado diagram, long a staple of risk and decision analytic methods, is disarmingly simple, but it can be surprisingly difficult to do right. Tornadoes are on my mind lately because we’ve recently published a video on them:
So what is a tornado diagram?
A tornado diagram is a special bar chart which is the graphical output of a comparative sensitivity analysis. It is meant to give you, the analyst, an idea of which factors are most important to the decision/risk problem at hand. It can also be useful as part of the analytical project’s results, giving the decision makers some insight into the uncertainties and their potential impact.
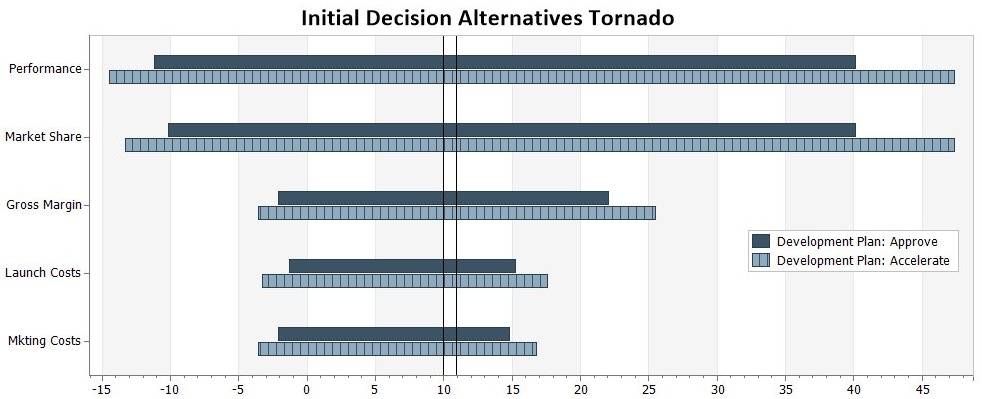
The x-axis of a tornado diagram is the value of the primary objective function (NPV, Profit, Total Cost, etc). The vertical line represents the objective function value of the base case (or sometimes an expected value). Each uncertain factor in the model has its own bar, and the width of each bar shows how much impact that factor can have on NPV when varied through a range. Some tornado diagrams from DPL, including the one below, also use colors to indicate a variable’s potential impact on the optimal decision policy. The bars in a tornado diagram are arranged in descending order of width, so that the diagram is essentially a ranked list of things you should be worried about.
A variable with a wide bar is called value sensitive, meaning it can cause a large change in the value of the objective function. A variable that can cause you to change your preferred decision alternative – such as one with a color change in the DPL Base Case tornado to the right – is called decision sensitive. Both are important.
What is a good tornado diagram?
A good tornado diagram is one that gives a fair ranking of the value and decision sensitivity of a decision problem to several risk factors. Fair means we’re not letting quirks of the model structure, or our own laziness, obscure the true importance of the factors.
Why is it important to have a good tornado?
A tornado diagram is a step along the way to a quality decision. The tornado informs your decisions about modelling, rather than the actual decisions that are the subject of the analysis. Tornado diagrams are intuitive and are often shared as part of the final results, but keep in mind that knowing which risk factors have the most impact is different than knowing what you should do. Sometimes the bar at the top of the tornado is irrelevant to the decision: it produces big swings in value, but affects all strategies equally. Value sensitivity is something we always want to know about, but if we have decisions to make, the the decision sensitive factors can’t be ignored. Decisions are where management action can make a difference.
What about bad tornado diagrams?
There are plenty of ways to generate a bad tornado. In most cases, the impulse that leads you astray is the understandable desire for objectivity. Shouldn’t we rely on a consistent set of rules rather than making every tornado essentially hand crafted? This is where things get subtle. To be meaningful, the tornado needs to have a logical consistency: the bars have to be measured against a common yardstick, both in terms of the range of uncertainty they represent (the most common assumption being the 10th and 90th percentiles of a distribution – a centered 80% confidence interval), and the value metric. But a naive attempt to be mechanically consistent will often result in a tornado that is logically inconsistent.
The following are some popular ways to do it wrong:
-
To be consistent, I’ll vary each risk factor by +/- 10%.
This is the most common bad tornado. And it’s really bad. This feels like a discretely approximated partial derivative of the objecting function with respect to the risk factor – hey, we paid attention in that math class. Using +/- 10% on the values only makes sense when all the uncertainties have the same variance – i.e., basically never. To see why these tornadoes are so bad, imagine that you are looking at the business plan of a brand new startup company that has never sold a widget. Would +/-10% of its forecasted sales represent the same amount of uncertainty as +/-10% of its tax rate? You need to spend some time and do the range assessments right (an almanac exercise also helps). -
For the base case, I’ll use the middle/nominal branch of each uncertainty.
This is fine for highly symmetric models with 10/50/90 assessments leading to 30%/40%/30% Low/Nominal/High chance nodes. However, once things get asymmetric this falls apart. For example, what if you have a node for Production Problem with states None, Major, Catastrophic and probabilities 95%/4%/1%? Are you going to use Major Production Problem in the base case? -
For the base case, I’ll use the most likely outcome of each uncertainty.
This works in more cases than #2, but doesn’t work for analysis of “early stage” problems, such as valuation of startup companies or pharma/biotech projects. What if a drug candidate has a 70% chance of failure in Phase II? Well, in your base case you never sold a pill, and your tornado is going to be mostly left of zero! (In this specific example, often the best thing to do is generate a “commercial given success” tornado with the pass/fail nodes controlled to pass, then a separate “technical success” tornado.) -
I don’t want decision changes to obscure the risk, so I’ll control them.
These tornadoes aren’t really bad, but they’re not the whole picture. It’s fine to use a decision controlled tornado to get an idea of risk, but if the analysis is focused on a decision, and you never look at the decision sensitivity of the risk factors, you’ve taken eye off the ball.
Why does DPL have so many types of tornado diagrams?
I hope I’ve shed some light on this question. The answer is because we want to help you create a good one! If you’d like to start generating some of your own good tornadoes in DPL, I recommend requesting a free 21-day DPL trial license: