There’s a handy feature in DPL for displaying risk profiles in an intuitive way: the “decumulative” switch. Decumulative doesn’t sound all that intuitive, but it is when you see it. Here’s a typical risk profile displayed in decumulative form:\
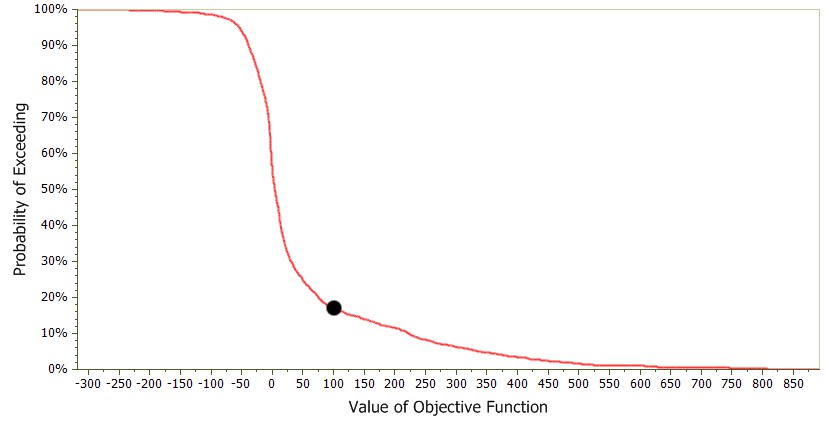
The great thing about this form of risk profile is that the axis labels explain the chart. Want to know the probability of the objective function exceeding 100? Read up from 100, over to the y-axis, and there it is: “Probability of Exceeding”.
Cumulative risk profiles are great if you’re used to them, but many people aren’t. When you ask a decision / risk analysis person to explain one, they usually mumble something about the integral of the probability densitiy function, which is true but a much higher lexile than “the probability of exceeding a given value”.
The Decumulative switch is in Chart | Format | Display (you’ll see the Chart | Format context tab when a risk profile window is selected).