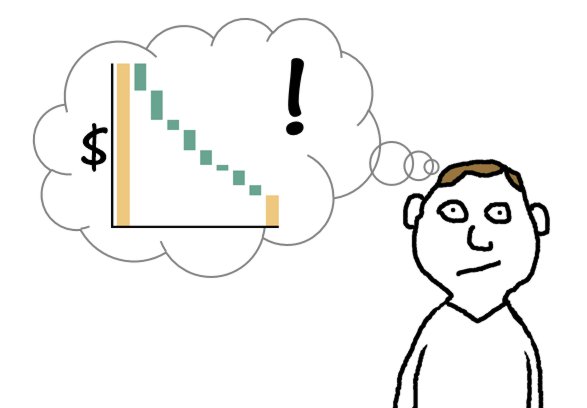
A topic of considerable lament in portfolio management circles is the frequent downward revision of project valuations. Anecdotally, it just seems like news tends to bring the project value down more often than it pushes it up. Senior management often views this as something sinister, a sign of deception or flawed execution: “Last year you bozos told me this was a blockbuster!”. Many organizations engage in elaborate year-on-year comparisons, to better understand why a project’s value has changed. These comparison processes can be borderline punitive. Indeed, sometimes the change in a project’s value gets more attention than what can be done to increase its value.
The conventional wisdom is that downward revisions are the result of early boosterism giving way to late stage reality. Project insiders know how much is being invested, and they have an idea of how large an expected NPV is necessary to justify that spend. If they’ve been puffing up their project’s valuation to enhance their own comfort, then they deserve to be beaten over the head with old sales forecasts, right?
I don’t dispute that simple optimism is part of project overvaluation, but it’s important to understand that even if it were completely eliminated, we would still expect more downward than upward revisions to project values, for reasons that have to do with simple math and the unavoidable uncertainty in project assessment. This is a flavor of what’s called Winner’s Curse in auctions.
The best way to understand this is with a simple example. Imagine that there are only two kinds of projects, good projects and bad projects. Also, imagine that we have a test which will usually (but not always) tell us if a project is good or bad (we’ll call the outcome of this test “looks good” or “looks bad”). The results are easy to see in the 2x2 matrix below (sorry, some of my best friends are consultants):
| I: Good Projects that Look Good | III: Bad Projects that Look Good |
| II: Good Projects that Look Bad | IV: Bad Projects that Look Bad |
We’ll fund projects that look good, that is, our portfolio will be made up of projects from quadrants I and III. Some really are good and others are false positives. Bummer about those ugly ducklings (false negatives) in quadrant II, but that’s water under the bridge. As the uncertainty in our portfolio plays out, and we start to learn more about the projects, some of those false positives are going to be revealed, and we’ll be very unhappy about those negative surprises/downward revisions. But most importantly, there won’t be any positive surprises to balance those out, because we chucked those ugly ducklings out of the portfolio last year.
Let’s say our test is 80% accurate for either case (i.e., there’s a 20% chance it will call a good project bad and a 20% chance it will call a bad project good). That’s a pretty decent test. If our project candidates are half good and half bad, we’ll end up with a portfolio with 80% good projects – not a bad outcome at all. But, suppose we have a “unicorn hunting” portfolio, and only 5% of project candidates really are good? Then ~83% of our projects are bad. Sorry, that’s just the math, no malice required.
Of course in real life, project values aren’t black and white, but the same result holds true once you introduce continuous project values and capital efficiency measures. It may be tempting to tighten the cutoffs, but that moves you in the direction of unicorn hunting.
So, what’s the enlightened portfolio manager to do? Well, you can try to improve the test, but uncertainty is a fundamental part of R&D, you can never wash it all out. In pharma, you don’t know what the molecule does in humans until you do the clinical trials. What you don’t want to do is make your test worse by devoting all your resources to downward revision post mortems. A team that’s focused on defensibility will not be producing their best estimates, and will clip the wings of the potential blockbusters they do find.
For a more rigorous discussion, see Jim Smith and Bob Winkler, “The optimizer’s curse: Skepticism and postdecision surprise in decision analysis”