DPL offers an easy-to-use decision tree modeling environment that provides analysts with a comprehensive set of robust decision framing and analysis tools. These combined with reliable Excel spreadsheet linking support can help provide you with the insights necessary to make the best, most informed strategic decisions for your organization. It is a complete decision analysis solution that supports the entire process from decision framing to confident action.
What is an Influence Diagram?
An Influence Diagram is a intuitive, graphical representation of a decision-problem. It is typically made up of 3 types of nodes (decisions, uncertainties, and values) and influencing arcs. Influence Diagrams are useful visual and communicative tools for displaying the main factors of a decision problem and the relationships between them. They are a compliment to decision trees, which display the decision structure and timing and whose branches grow exponentially with each variable.
View the short video below and see how easy it is to create and manipulate an Influence Diagram in DPL in order to frame a strategic business decision and gain key insights:
How can DPL help you make better decisions?
DPL provides more than just a computational method to solving complex, strategic decisions. The tool provides formal decision analysis framework; it’s a problem structuring and modeling approach as well as a communication tool. Here are a few specific features that really set us apart from the rest:
Treatment of Decisions
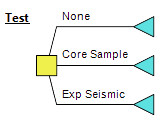
Through the use of Influence Diagrams and Decision Trees, a formal framework explicitly defines decisions and their alternatives, uncertainties and their outcomes, and the output metrics most important in making the decision. An analysis in DPL will indicate the optimal decision policy for up-front and downstream decisions.
Value of Information
DPL can automatically calculate the value of know the outcome of an uncertainty (information) in overall value measure terms so you can quickly and easily answer questions like, “How much should you invest in further research?” or “How much value is there in putting control systems in place?”.
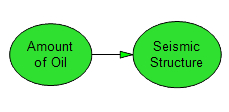
Dependence
Probabilistic and value-wise dependence between variables in the the decision model are specified explicitly as well and can be identified visually within the influence diagram. Other tools tend to offer a less rigorous approaches to dependencies, such as correlation coefficients, which most individuals have little intuition for.
Outputs/Results
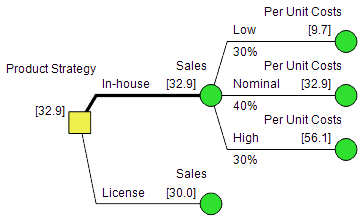
DPL also offers numerous, presentation-ready outputs that build understanding and confidence around the decision at hand. For example, each path in a DPL Policy Tree is a particular scenarios of the model. It can be leveraged as a strategic road map for making the best decisions and managing value now and in the future.
Who uses DPL?
DPL isn’t designed for a single industry vertical or decision-problem. For over 25 years DPL has been helping industry leading organizations make profitable decisions within a wide variety of industries, including Pharmaceutical, Oil & Gas, Electric and Utilities, Consumer Products, Mining & Energy, and the Aerospace and Defense sectors. See how DPL is leveraged to make good decisions and solve real world problems.

Valued DPL Customers
DPL offers a comprehensive decision modeling environment that incorporates Influence Diagrams, Decision Trees, and Excel.
We at Syncopation Software understand that critical business decisions deserve the most rigorous approach. Consequently, DPL offers the most complete and powerful set of tools on the market today for taking on major strategic decisions with inherent uncertainty. Through a powerful and unique Influence Diagram/Decision Tree combination DPL supports the entire analysis process, from structuring of the decision problem, through sensitivity and risk analysis, to the presentation-ready results and confident action!
BEST-IN-CLASS DECISION ANALYTIC TOOLS
DPL 9 is an intuitive, graphical Influence Diagram/Decision Tree software that provides insights that lead to better decision quality